Is There Actually a Teacher Shortage?

Susan Pendergrass speaks with Dan Goldhaber .

Dan Goldhaber is an AIR vice president and director of Analysis of Longitudinal Data in Education Research at AIR. He is also an affiliate professor in the School of Social Work at the University of Washington, the director of the Center for Education Data & Research, and the co-editor of Education Finance and Policy.

Listen on Apple Podcasts 

Listen on Stitcher 

Listen on SoundCloud

Map of Commercial Property Tax Surcharges in Missouri

I know, I know, if you are like most Missourians, you’ve been talking about the commercial property surtax (or surcharge) constantly over the past few months and you are probably tired of the subject. But stick with me for at least one more post on the subject. As you all undoubtedly know based on your many conversations on the topic with family, friends, co-workers, and if this is actually true, highly likely your therapist, the commercial surtax is a property tax levied at the county level on commercial property only. Unlike other property taxes, it does not adjust downward as assessment value increases and it cannot be lowered by elected officials. Per the Missouri Constitution, it cannot be raised, and only voters can lower it. To date, voters in Missouri have never lowered a surcharge tax rate, but in November, voters in Clay County will have the opportunity to be the first to do so. The modest reduction Clay County is proposing to equalize itself with Jackson County, in my opinion, is very good public policy, but more on that later.

The tax rate varies by county based on the amount of money the tax it replaced—a commercial inventory-based tax—raised in each county in 1985. If your county had many businesses that generated products subject to the inventory tax, such as Clay County with the Claycomo Ford Plant, you probably have a high replacement tax rate. If you are a county that had a lot of businesses that did not generate much taxable inventory, such as counties in the Lake of the Ozarks region with its tourism economy, you likely have a low commercial surtax rate. But the real issue is that because of the difficulty in adjusting the rate, counties still have the rate based on the economic conditions of 1985.

That is why we built this map. The map below shows the commercial surtax rate for every county in Missouri. The redder the county, the higher the rate. The rate varies from $1.70 per $100 of assessed commercial valuation in St. Louis County to $0.01 in Reynolds County. The unweighted average rate is $0.53; the median rate is $0.41. Please check out the map (there is also a download link at the bottom of the post) and see where your county fits.

Part 8: Does Kansas City Have and Affordable Housing Problem?

(You can read part onepart twopart three, part fourpart five, part six, and part seven in this series here.)

Our results in the previous blog post indicate that Kansas City may have an affordable housing problem, but one that doesn’t affect most residents. These findings don’t seem to match public perception on the issue. According to a recent national poll, approximately 90% of respondents stated they believe housing affordability to be a major issue where they live. According to the table below, using data from the same American Community Survey as used previously in this series, many households in Kansas City say they are spending more than 30% of their income on housing. Does that confirm there’s an affordability problem or is there more to the story?

Using household income as our primary measure for housing affordability may make the most sense based on the data our government collects, but it is not a perfect measure for gaining insight into what households find affordable, especially for those with lower incomes. For example, if you don’t have a car or another means of transportation, housing that’s miles away from your place of work that costs 30% of your income is likely not affordable once daily commute costs are taken into account.

In times with record-breaking inflation like we’re seeing now, and rising home prices, it’s easy to feel like there’s a housing affordability problem. Because for many people, the place they live or want to live has become more expensive to them. And as long as all Kansas Citians, regardless of income, are allowed to freely choose where they live and pay how much they feel they can afford to pay to live there, these same data will show some level of housing unaffordability that is not reflective of a need for government intervention, but a result of consumer choice.

That’s also why when discussing housing affordability and the public policies that are aimed at combatting the issue, we have to be careful and say specifically what we mean or the policies that follow will be sure to miss the mark. As I hope my posts have made clear, affordable housing policy is hard. Moreover, with house prices, rents, and interest rates rising more rapidly than incomes, the debate over housing affordability is likely to grow, and with it, the potential for misleading analysis and counterproductive policy solutions. In particular, any one-size-fits-all policy that aims to improve housing affordability in Kansas City by treating households with varying incomes the same would likely not be successful at achieving the desired results.


Part 7: Does Kansas City Have an Affordable Housing Problem?

(You can read part onepart twopart three, part four, part five, and part six in this series here.)

In the last post in this series, I talked about how to estimate potential housing demand. Now it’s time to talk about the supply. Since the majority of households earning below the area median income (AMI) are renters (as the graph in the last post showed), we can use census data to determine the number of units rented in Kansas City and how much they cost, which should give us a pretty good estimate of the supply of rental housing.

As the figure below shows, there weren’t many rental units available for less than $500/month at the time the survey was conducted, but there are more than 123,000 available between $500–999 per month. Moreover, the data below are not broken down by the number of bedrooms. Undertaking an even more granular analysis of the balance between housing demand and supply through a decomposition by family and unit size is left for future analysis.

With that in mind, we can combine the data we’ve put together in the last two posts to strictly compare the estimates of affordable housing supply with demand. This allows us to establish a potential surplus or shortage for any income group. Using the table below, we can see for each income bracket the supply of affordable housing. Then, by subtracting the demand for units from the supply, we can determine whether there’s a surplus or shortage of housing at the 30%-of-income affordability threshold for households at each income level.

The table above shows that there is a shortage of housing under the 30%-of-income affordability threshold in the Kansas City area for those making less than approximately 30% of the AMI but a significant surplus for all remaining income groups

The results in the table above are similar to what I referenced in part 5 of this series about a supply and demand analysis of St. Louis City and County contained in a report commissioned by the Community Builders Network of Metro St. Louis for the Affordable Housing Trust Fund Coalition. It’s not that Kansas City clearly lacks rental housing, but it may lack sufficiently affordable rental housing for the city’s poorest residents. And when “affordable” in this instance means rents lower than $580/month for a family of three, it’s somewhat understandable that such places could be hard to come by.

It is important to remember that these estimates for the potential housing supply and demand in Kansas City are only as good as the assumptions made to create them. In the next post, I’ll dive a little deeper into how different examinations of the same data can lead to different results for what should be done in Kansas City.

Fall 2022 Internships

Positions Open

The Show-Me Institute is pleased to offer internship opportunities for Fall 2022.
  • Internships are open to current undergraduate and graduate students, as well as recent graduates.
  • Summer internships will last approximately three months. The exact starting and ending dates are flexible, but each intern is expected to work at least 10 weeks. No internship shall start prior to September 6.
  • Fall interns will work a part-time schedule in the office, with exact hours to be determined later.
  • Interns will be involved in many aspects of the Institute’s operations. Interns will work closely with senior staff on a wide variety of projects. They can expect greater responsibility and personal attention than they would receive at larger organizations.
  • Interns will assist staff members with a variety of public-policy related tasks. These may include researching public policy topics, organizing events, and writing and editing op-eds, newsletters, blogs, studies, and other documents. Some administrative and clerical tasks will also be required.
  • A Show-Me Institute internship is an excellent opportunity to improve your research and writing skills. Each intern will produce regular blog posts and an op-ed on a public policy topic of interest to him or her. Each intern will receive feedback and assistance from SMI staff members throughout the process.
  • All internships are at the Show-Me Institute’s offices in Saint Louis, Mo.
  • Interns will be paid on an hourly basis.

Those wishing to be considered for an internship should submit an application and the requested supporting materials. The deadline for applications is August 29, 2022. However, we will begin conducting interviews as applications are received. Applicants can expect a decision no later than early-September.

About the Show-Me Institute

Founded in 2005, the Show-Me Institute is a nonpartisan, nonprofit public policy research organization. The mission of the Institute is advancing liberty with responsibility by promoting market solutions for Missouri public policy. For more information:

Phone: (314) 454-0647

Email: [email protected]

Part 6: Does Kansas City Have and Affordable Housing Problem?

(You can read part onepart two, part three, part four, and part five in this series here.)

As earlier posts in this series have explained, defining an affordable housing problem is complicated. So too, is solving one. Because the issue is so complex, the definitions and data used to characterize the issue are incredibly important. Over the next two posts, I’ll walk through an analysis that sheds light on the affordable housing situation in Kansas City, which can then serve as a jumping-off point for a discussion of potential solutions for the region.

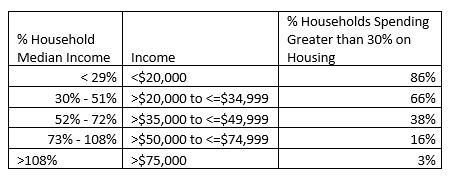
Even though the U.S. Department of Housing and Urban Development (HUD) defines “affordable housing” as a household spending no more than 30% of their income on housing, it is important to distinguish between situations where households exceed that threshold out of necessity because of a lack of sufficient options versus situations where they actively choose to spend more than 30% of their income on housing even when more affordable and still viable options are available.

Every household is free to choose where they want to live and pay what they feel they can afford to pay regardless of whether the government would view their choice as “affordable.” Conversely, there is nothing wrong with choosing to spend as little on housing as possible. The point is that while an aggregate story tells a tale, the personal stories of individual Kansas Citians shouldn’t be lost in our discussion.

For these reasons, this post focuses on estimating the potential demand for affordable housing–namely, the number of units needed at different cost points to accommodate Kansas City households if they were to spend no more than 30% of their income on housing. This analysis is primarily about households making less than the area’s median income (AMI), as the term is defined and published by HUD. In Kansas City, the AMI for a family of three is $78,000 per year.

To determine the potential demand for affordable housing, we need an estimate for the number of households in different income ranges, and then we can multiply each income range by 30% and divide by 12 to arrive at the monthly housing cost range that would be affordable to those households. The definition of income we use comes from the U.S. Census Bureau’s American Community Survey (ACS) and encompasses labor market earnings, self-employment income, interest and dividends, retirement income, and “any public assistance or welfare payments from the state or local welfare office” but not other sources of government assistance such as Medicaid.

In principle, one could consider augmenting this measure to include non-cash benefits like Medicare for retirees, Medicaid, employer-provided health insurance and other such fringe benefits in the income measure for purposes of calculating the 30% affordability thresholds. But obtaining data on each of these items is quite difficult, and deviating from the widely used ACS definition would entail making judgment calls about the cash value that households attach to them.

For example, if a household receives $20,000 of income a year according to the ACS income definition, the 30% of income affordability threshold for the household would be $500 (= $20,000 x 30% x 1/12) in rent or mortgage payments. If the household also receives Medicaid benefits that cost the government $6,000 to provide—and if the household would have otherwise chosen to spend that same $6,000 itself absent Medicaid—then the household’s income effectively rises to $26,000, and one could argue that the affordability threshold should increase to $650 (= $26,000 x 30% x 1/12). However, if the household would not have spent a full $6,000 to obtain alternative health insurance in the absence of Medicaid, the cash equivalent value is less, and the affordability threshold would be between $500 and $650. Thus, you cannot assume that various government benefits are the equivalent of income.

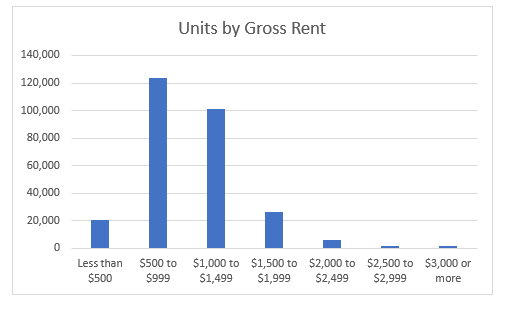
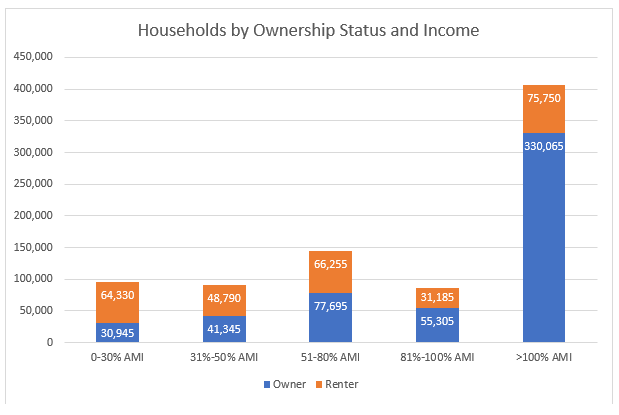
You can see in the table below based on data from the ACS and compiled by HUD that there are approximately 820,000 households in the Kansas City metropolitan area. Additionally, the majority of those making less than the AMI are renters (which should make some intuitive sense).

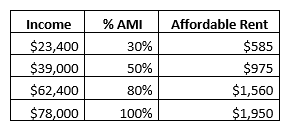
The table below gives an idea of how much a family of three with various incomes below the AMI can pay for housing that is considered affordable using the 30% rule of thumb from HUD.

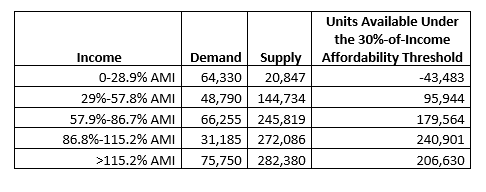
Taken together, we have an idea of how much housing could be needed in Kansas City, and at what price points. The next question is how those figures compare to the reported supply of housing in Kansas City, which will be the topic of the next post.

We Gave DESE a Report Card

2020-2021 Data Now Available at MoSchoolRankings.org

Missouri Has an Education Emergency

Missouri schools are failing to teach the core subjects of reading and math and the most recent test scores show that students are falling further behind.

Missouri’s Department of Secondary and Elementary (MO DESE) has not offered the level of transparency regarding student performance that is necessary to create an education system focused on higher standards, reducing achievement gaps, and results-based accountability.

The status quo is leaving thousands of students behind without the fundamental skills to pursue higher education or compete in the modern labor market.

About the Project

In response to DESE’s failure to perform one of its most basic functions, we launched The Missouri School Rankings Project and MoSchoolRankings.org.

The mission of The Missouri School Rankings Project is to make student performance data more transparent by providing parents, policymakers, educators, and taxpayers with access to easy-to-understand information about every Missouri school and school district in order to motivate actions that will result in dramatic reforms to Missouri’s education system.

Visit MoSchoolRankings.org

Eureka Water Privatization Is a Very Good Thing

The Post-Dispatch had a very long story about the just-finalized sale of Eureka’s (an outer suburb of St. Louis) municipal water system to Missouri American Water. Missouri American paid Eureka $28 million for its water and sewer systems, which will now be operated by the private company instead of the city. A few years ago, Missouri American paid Arnold (another outer suburb of St. Louis) $21 million to buy its sewer system. Liberty Utilities just purchased the water and sewer systems in Bolivar in Southwest Missouri. The trend for these privatization sales is growing.

These privatization deals are a wonderful thing that should be encouraged and expanded in Missouri, including for our largest cities and their water divisions. More stringent health, environmental, and other regulations (both necessary and not) are making it harder for local communities to operate their water and sewer systems properly. The Post-Dispatch article mentions right at the start how bad the water in Eureka is currently: “It’s the worst water I’ve ever tasted in my life,’ said Eureka resident Thomas Ferrari.”

The main complaint about privatization is that rates will increase. Yes, they often do, and that is typically a necessary thing. Municipal utilities frequently underprice water, electric, and gas rates because those pricing decisions are made by politicians who want to keep voters happy. That may help with re-election, but it makes necessary system investments more difficult. From the Post-Dispatch story:

Arnold sold its sewer system to Missouri American in 2015 for $21 million. “The system was not in good shape. It was not well maintained,” said City Administrator Bryan Richison. “And city council members were running on not raising rates, so it put us in a bad position.”

The water in the City of St. Louis may taste great (it does), but the city water division there has done a poor job of reinvesting in its system and incorporating new technology into service. As astounding as it may be, the City of St. Louis water division has still never installed water meters in most homes to measure water usage and bill accordingly. You get charged for water based on a variety of physical factors, so if you want to water your lawn for 12 hours a day you pay no more than your neighbors. That’s terrible public policy and results in inefficient, wasteful use of water.

Water and wastewater privatization is very good public policy that we need more of in Missouri. Private utilities adopt technology more quickly, expand the tax base, invest in their systems more reliably, and are regulated by the state’s public service commission on their rates. More municipalities with their own water, electric, and gas utilities should follow Eureka and Arnold’s lead and privatize for everyone’s benefit.

Support Us

The work of the Show-Me Institute would not be possible without the generous support of people who are inspired by the vision of liberty and free enterprise. We hope you will join our efforts and become a Show-Me Institute sponsor.

Donate
Man on Horse Charging