Missouri has made strides in occupational licensing in recent years, but a little-known exception in our licensing system has the potential to undermine its effectiveness.
The Current State of Occupational Licensing in Missouri
In 2020, Missouri adopted a form of universal licensing reciprocity, allowing most professionals (there are some exceptions) who have held a valid license issued by another state for at least one year to practice in Missouri at the same occupation or level, and have all Missouri licensing requirements waived.
However, this policy has a little-known exception, known as the “compact exception,” which states:
[Reciprocity] Shall not apply to an oversight body that has entered into a licensing compact with another state for the regulation of practice under the oversight body’s jurisdiction.
A licensing compact is an agreement between multiple states to recognize each other’s licenses, but it is governed by its own set of rules and oversight. One reason that licensing boards like to join compacts is because it makes it easier to process new licensure applications. These compacts act as a central hub with all the information needed for processing the application.
However, due to the “compact exception,” joining certain compacts can increase the regulatory burden in Missouri. This is because the compact exception overrides universal reciprocity, and boards can limit eligibility to only its member states and those following the compact’s rules. In such cases, licensing reciprocity only extends to workers from other states in the compact, instead of any qualified and licensed person who wants to move to Missouri and begin working. Yet, some compacts explicitly preserve reciprocity and state regulations, and allow the compact to serve as a voluntary option for licensing. Given this, officials must carefully evaluate how each compact would treat our universal licensing regime if passed.
Different Missouri Compacts
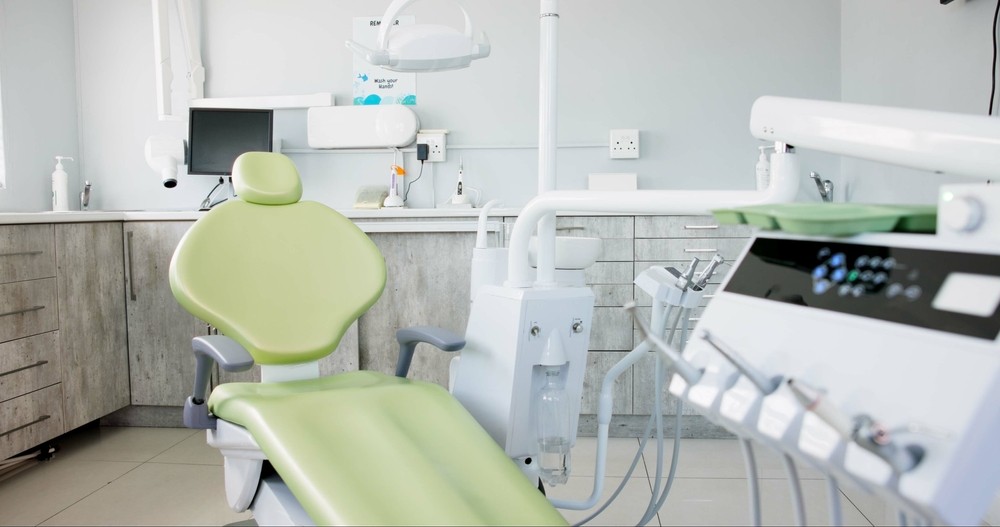
Senate Bill (SB) 109 is one compact that may not fall into the trap of increasing the regulatory burden in Missouri. While this compact only has 10 member states, it appears that this compact is voluntary and serves as one option to streamline the transition for dentists and dental hygienists across state lines. It states:
Allows each state to continue to regulate the practice of dentistry and dental hygiene within its borders;”
“Eligibility or ineligibility to receive a Compact License Privilege shall not limit the ability of a Licensee to seek a state license through the regular process outside of the Compact.
Since this compact does not appear to supersede Missouri’s licensing reciprocity, it wouldn’t negatively affect people moving to Missouri.
Always Read the Fine Print on Licensing Compacts
In theory, compacts should make it easier for Americans to move all around the country, but some act as a pathway for asserting regulatory control. A compact can be used by interested industries to raise licensing requirements in states that cut back on regulation, increasing costs for both consumers and potential entrants alike. It is important to read the fine print to ensure that our universal licensing reciprocity is not superseded.