
Hair Braiders Continue Missouri Licensing Fight

Last month we published a paper on medical licensing and reforms that could make care more available to Missouri patients, but the lessons from that essay—unshackling supply to meet customer demand—are not exclusive to the medical profession. Indeed, licensing laws can act as unnecessary barriers not only to customers seeking medical services, but also to professionals in other fields who are ready and able to offer services to customers who need them.

That unnecessary inteference by government is the basis for a lawsuit filed in 2014 by the Institute for Justice against Missouri's Board of Cosmetology and Barber Examiners and on behalf of two St. Louis-based hair braiders. As IJ explains on its website,

If you want to braid hair for a living in Missouri, you must spend thousands of dollars on at least 1,500 hours of cosmetology training that teaches you nothing about African-style hair braiding. That’s far more time and money than it takes to become a licensed EMT in the state.
 
Joba Niang and Tameka Stigers have been braiding hair for much of their lives and each woman owns a successful hair braiding business. African hair braiding is a centuries-old natural hair care technique that uses no dyes or chemicals; it is safe for the braider to perform and does not hurt the person getting their hair braided. But Missouri wants to turn the two women into criminals.
 
First, the bad news. In September a federal judge ruled against the hair braiders, saying that the Board's licensing regime was acceptable "despite claims from braiders that the process is irrelevant to what they do, unnecessary and expensive." IJ plans to appeal.
 
But the good news is that along with the potential for relief on appeal, newly-minted Missouri state legislators could always simply revisit the issue of licensing in the next legislative session and, just reform the law for braiders and other professionals. Certainly there have been attempts at reforming licensure in the past, with some positive results, but as a general matter it's been slow going in this policy area.
 
That needs to change. It's clear that Missouri's licensing system is in need of a significant overhaul—for medical professionals, hair braiders, and other professionals. And regardless of what happens in the courts, I hope we see progress in licensure reform in the legislature in 2017. It would be good for workers, and for consumers.


Subsidies in St. Louis, Part 2: Economic Development Blunders

City officials, developers, and corporate welfare proponents have touted the benefits of development incentives like tax-increment financing (TIF) to taxpayers for years. These subsidies make investments like the construction of office towers and entertainment districts possible, helping to create jobs and rejuvenate neighborhoods. Or so we’ve been told.

The recently released St. Louis Development Corporation (SLDC) incentive report casts doubt on those claims. Incentives, the report concludes, provide little or no economic development benefits. They may help put up shiny new buildings, but they don’t genuinely boost Saint Louis’s economic health.

This is what the research tells us:

There is little or no connection between the use of incentives and job growth. Although proponents claim TIF will help bring jobs to the area, there is almost no connection between increased employment and TIF. For every $1 million of TIF invested, there are only seven associated jobs (p. 95). And the few construction-related jobs created by TIF have huge costs. In 2015, each job created by TIF in St. Louis cost taxpayers more than $53,000.

But it gets more disturbing. According to Missouri’s annual TIF report, even when controlling for developments less than 5 years old, less than 35% of projected jobs listed in developers’ proposals have actually been created or retained by TIF projects in St. Louis. And because TIF job creation figures are self-reported and unaudited—it’s possible that even the 35% number is overstated.

TIF does not help rejuvenate neighborhoods or spark further investment. When researchers looked at neighborhoods with incentive-driven development, they found that only the parcels that receive incentives increase in value. The SLDC report found zero evidence that a statistically significant increase in property values can be attributed to the effect of TIF-spurred development. The neighborhoods surrounding TIF projects are no more likely than unincentivized areas to see other large investments without incentives. In short, so-called “anchor developments” provide no real benefit to their neighborhoods.

The researchers concluded that, “[w]hile there may be disagreement about the value of some packages, it is clear that the City gains no net benefit from an extremely costly program with no real economic development impact” (p. 6, my emphasis). Along the most important measures of success—job creation and neighborhood revitalization—incentives appear to fail, making it hard to justify continuing to spend tens of millions of dollars each year subsidizing development projects.

(Read part 1 in the series here)

Entrepreneurship in Missouri, Part 3: The Startup Environment

This series on entrepreneurship has highlighted the fact that the percentage of workers  in startups is at its lowest level in Missouri in 20 years. In fact, job growth from startups has been floundering throughout the seven years since the recession ended.  In this last blog in the series, we will review two partial but significant explanations of declining startup growth in Missouri, Kansas City, and Saint Louis: net population flows and business consolidations. The research on the relationship between these two factors and entrepreneurship comes from Ian Hathaway from Ennsyte Economics and Robert E. Litan from the Brookings Institution.

Hathaway and Litan found that the more population growth an area experiences, the more likely the area is to see startup activity. Tax migration flows show that Missouri has seen a net outflow of people since 2011, driven by larger outflows from Kansas City and Saint Louis. While it is still possible for Missouri, Kansas City, and Saint Louis to grow in entrepreneurial activity despite a net migration loss, Hathaway and Litan find that those areas with fast and positive migration have more entrepreneurial activity. Unfortunately, that migration isn't really happening in the Show-Me State.

The business consolidation rate that Hathaway and Litan use is calculated by dividing the number of firms (e.g., Home Depot) by the number of establishments (individual Home Depot stores) within an area. Business consolidation can be a good indicator of business cost pressures, because as the costs of maintaining a firm’s establishments increase, business owners may decide to close or consolidate establishments. Therefore, a falling business consolidation ratio (i.e., each firm operates more establishments) indicates that overall, firms are expanding. On the other hand, a rising ratio indicates that firms are contracting their business operations.

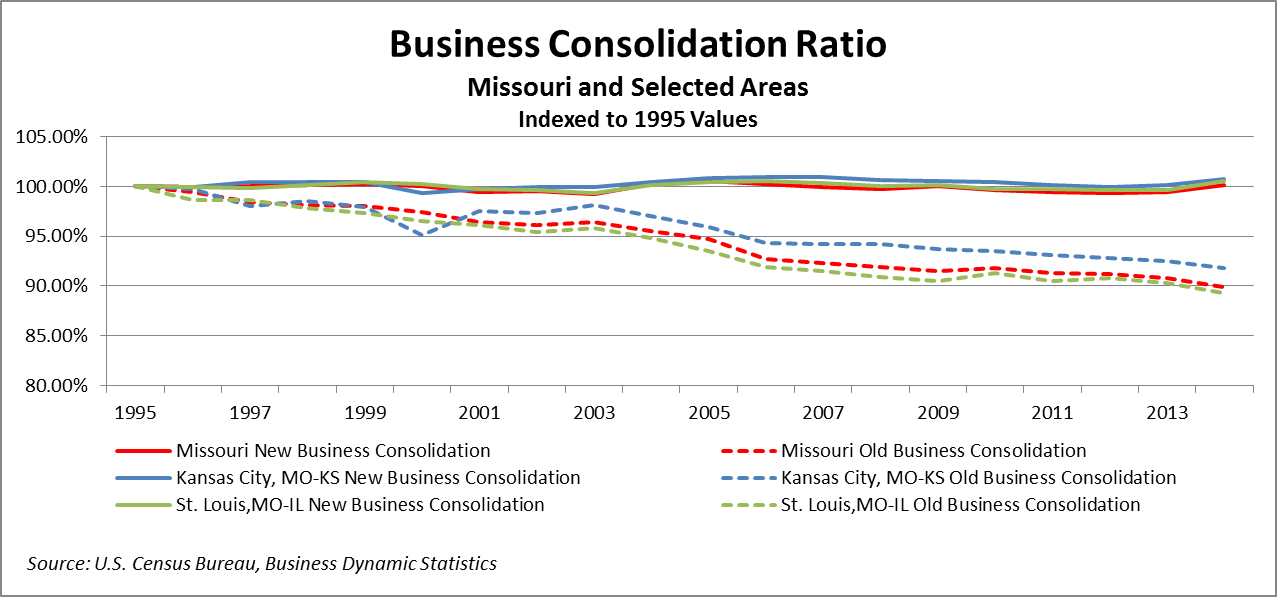
The business consolidation ratio for older firms in Missouri seems to be declining over time, which may suggest that, on aggregate, these businesses are able to manage their costs of doing business and are expanding. For startups, however, business consolidation has remained flat, suggesting cost pressures may continue to be a problem for these new or relatively new companies. The chart below captures these trends.

Remember: the downward slope of a line is a good thing, and reflects better conditions for a firm’s expansion. Policymakers should take a closer look into the startup environment, because review of Missouri, Kansas City, and Saint Louis shows that startups aren’t doing nearly as well as older and more established firms in terms of expansion. Over the last 10 years or so, the gap between established firms and startups has grown without pause.

How can Missouri policy help foster an environment in which entrepreneurs not only want to operate here, but also enjoy enough success that they are able to expand their operations? My first post in this series outlined how Kansas City businesses are enticed to move to lower-tax environments, indicating that tax policy might be a good place for policymakers to start. In addition, with Missouri ranked 29th in least-burdensome regulations for startups, (see page 49)., regulatory reform is another area where improvement would be welcome. 

Creating a Field of Dreams for the American Royal

With the World Series in full swing, I’m reminded of a quote from one of my favorite sports movies, Field of Dreams: “If you build it, he will come.” I wouldn’t be surprised if these same words were in the minds of Kansas economic development officials when they successfully recruited the 117-year old American Royal from Missouri to Kansas earlier this week. But the Royal’s move isn’t just bad news for Missourians; it’s also terrible policy for Kansans.

The Royal is a Kansas City institution, one whose fall catalog of rodeos, barbeque, and livestock competitions herald the start of winter and the region’s holiday season. Thanks to tens of millions in sales tax revenue STAR Bonds, those traditions will soon move away from the Royal’s current digs in Kansas City, Missouri, to nearby Kansas City, Kansas. Kansas’s $80 million contribution to the project is about double what American Royal was publicly trying to get out of Kansas City, Missouri, officials just two years ago to keep the Royal in the city’s West Bottoms.

But did Kansas even have to “build it” with taxpayer money to entice the American Royal to move? The Royal’s brand is defined by its history in the Kansas City area—even Kansas City’s baseball team is named after the organization—so it’s safe to say that American Royal wasn’t going to move its operations to Texas or Florida.

But setting aside for now the important question of whether this is an appropriate role of government (it isn’t), Wyandotte County has been seeing significant economic growth that would have made it an attractive landing spot for the Royal anyway. More families are moving there today than were coming 10 years ago. In 2004, 1,871 tax filers—bringing more than $57.6 million dollars of income—moved to Wyandotte; fast-forward to 2014, and tax filers were pouring in 25% faster, bringing in around $74 million with them.

Wyandotte County was “building it”—a functioning economy that has, in contrast to its basket-case reputation, attracted investments from Google, Amazon and others in recent years—before Kansas’s $80 million incentive was ever put on the table.

But Wyandotte’s recent successes don’t justify Kansas’s decision to subsidize the American Royal move. Indeed, the state’s $80 million giveaway has all the hallmarks of bad policy and poor judgement from Kansas’s political class. The American Royal was already getting cheaper land and a prime location close to its support bases in Johnson County, Kansas, and Kansas City, Missouri. The tens of millions in taxpayer support is just the KC Strip on top of this gravy train sundae.

Kansas? Sure, it gets a talking point in the battle for the economic soul of the region, but it’s a point that is likely to be eclipsed by the next round of billion-dollar business-poaching that’s certain to come.

While the Royal’s decision could be seen as a slap in the face of its historical roots, Kansas City, Missouri isn’t exactly a victim in the matter, either. The city has a terrible track record of poaching Kansas businesses in precisely the same way and is an equally bad actor in the billion-dollar tax-incentive border war that has bedeviled the region, creating no strategic advantages on either side of the border.

To put it delicately, the bull manure is blowing onto taxpayers from both sides of State Line Road. It’s time to end this tax incentive rodeo and finally pursue a mature economic development policy—one that doesn’t force taxpayers to build the fields of their politicians’ dreams.

Maps: Average Insurance Exchange Rates in Missouri, By County

Yesterday I published the full list of ACA monthly insurance rates by county in Missouri, as compiled by the federal government. Today I'm sharing a map of each type of plan for one demographic, 40-yearold individuals, since it pretty well reflects the geographic differences in prices that we're seeing across the state. A few quick notes on using the interactive features:

  • Mouse over individual counties to see their prices.
  • There are tabs in the upper left corner that let you scroll through the different plans—Gold, Silver, Bronze and Catastrophic—and their prices. I encourage you to cycle through them, because the maps for each plan level are different.
  • For easier viewing you'll also find in the lower right hand corner a "full screen mode."
  • Where counties are blue and have no prices, that means that, according to the data released, there will be no plan of that type available in that county in 2017. 


The NAACP’s Misguided Opposition to Charter Schools

The National Association for the Advancement of Colored People (NAACP) passed a resolution on October 15 calling for a nationwide end to charter school expansion. This resolution has been controversial because many African-American parents have become strong advocates for charter schools after seeing their benefits.

In Missouri, Charter Schools overwhelmingly serve African-American students. According to DESE, the 72 charter schools in Kansas City and Saint Louis enrolled over 21,000 students in 2016, two-thirds of whom were African-American.

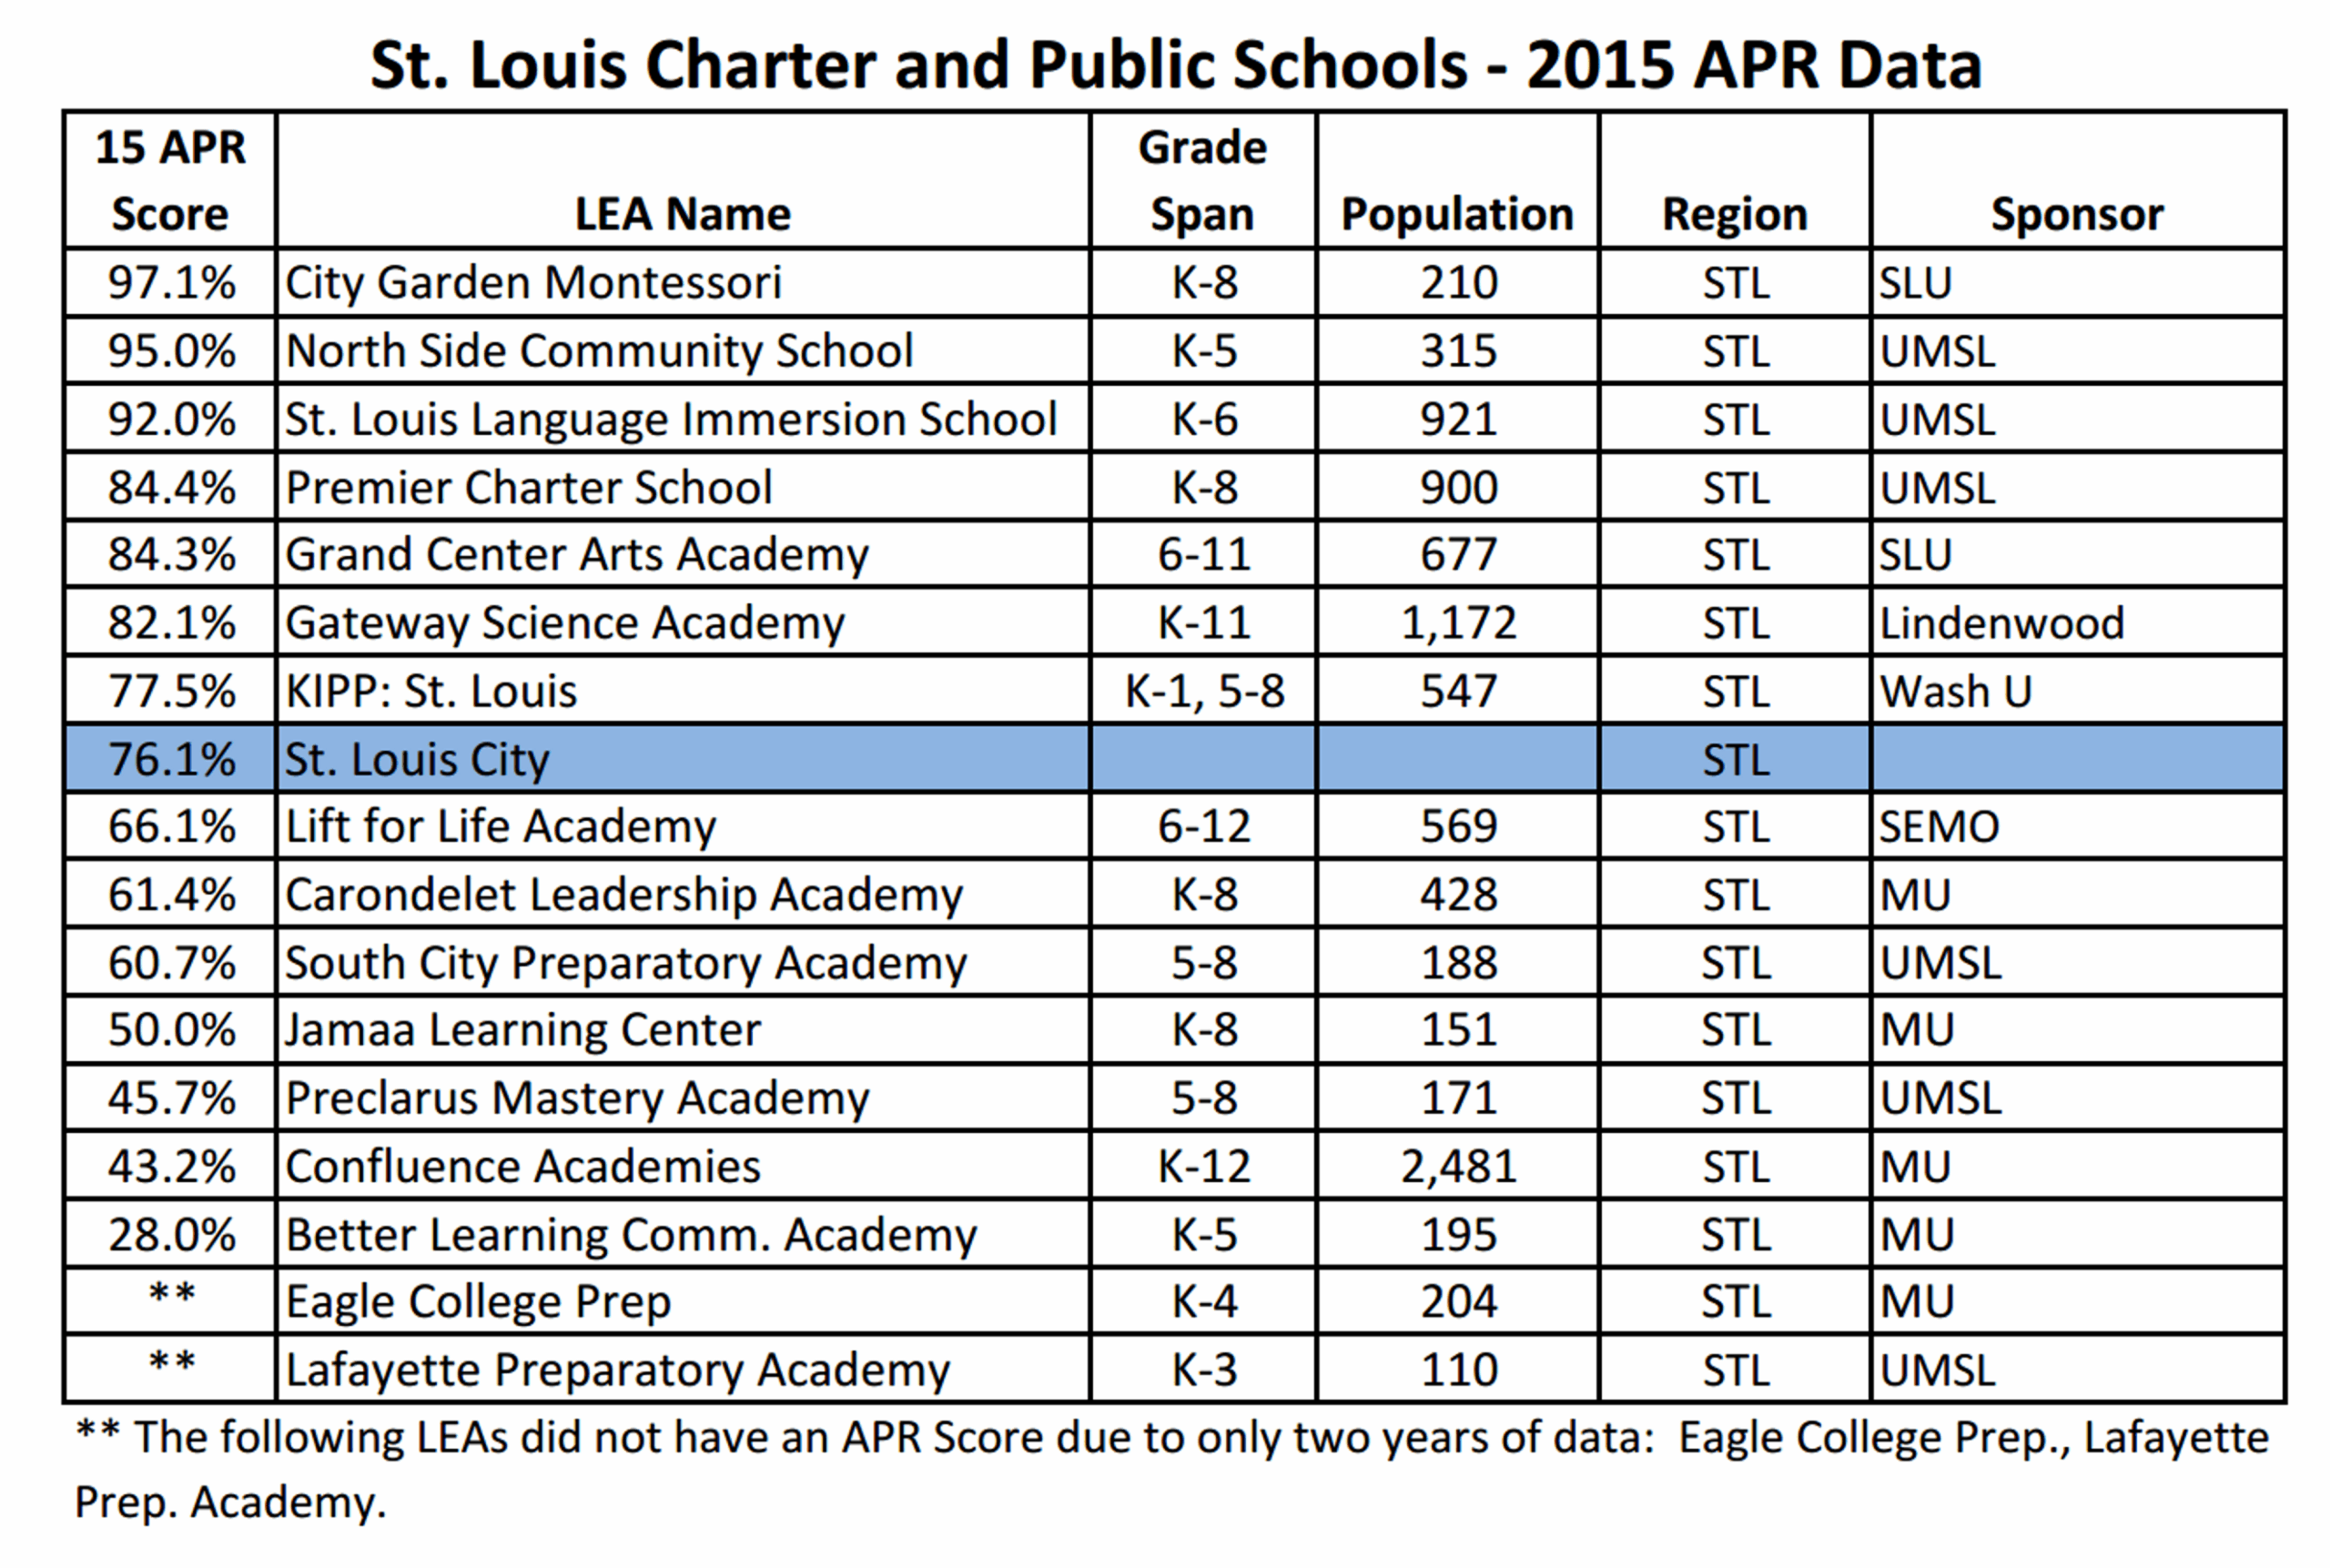
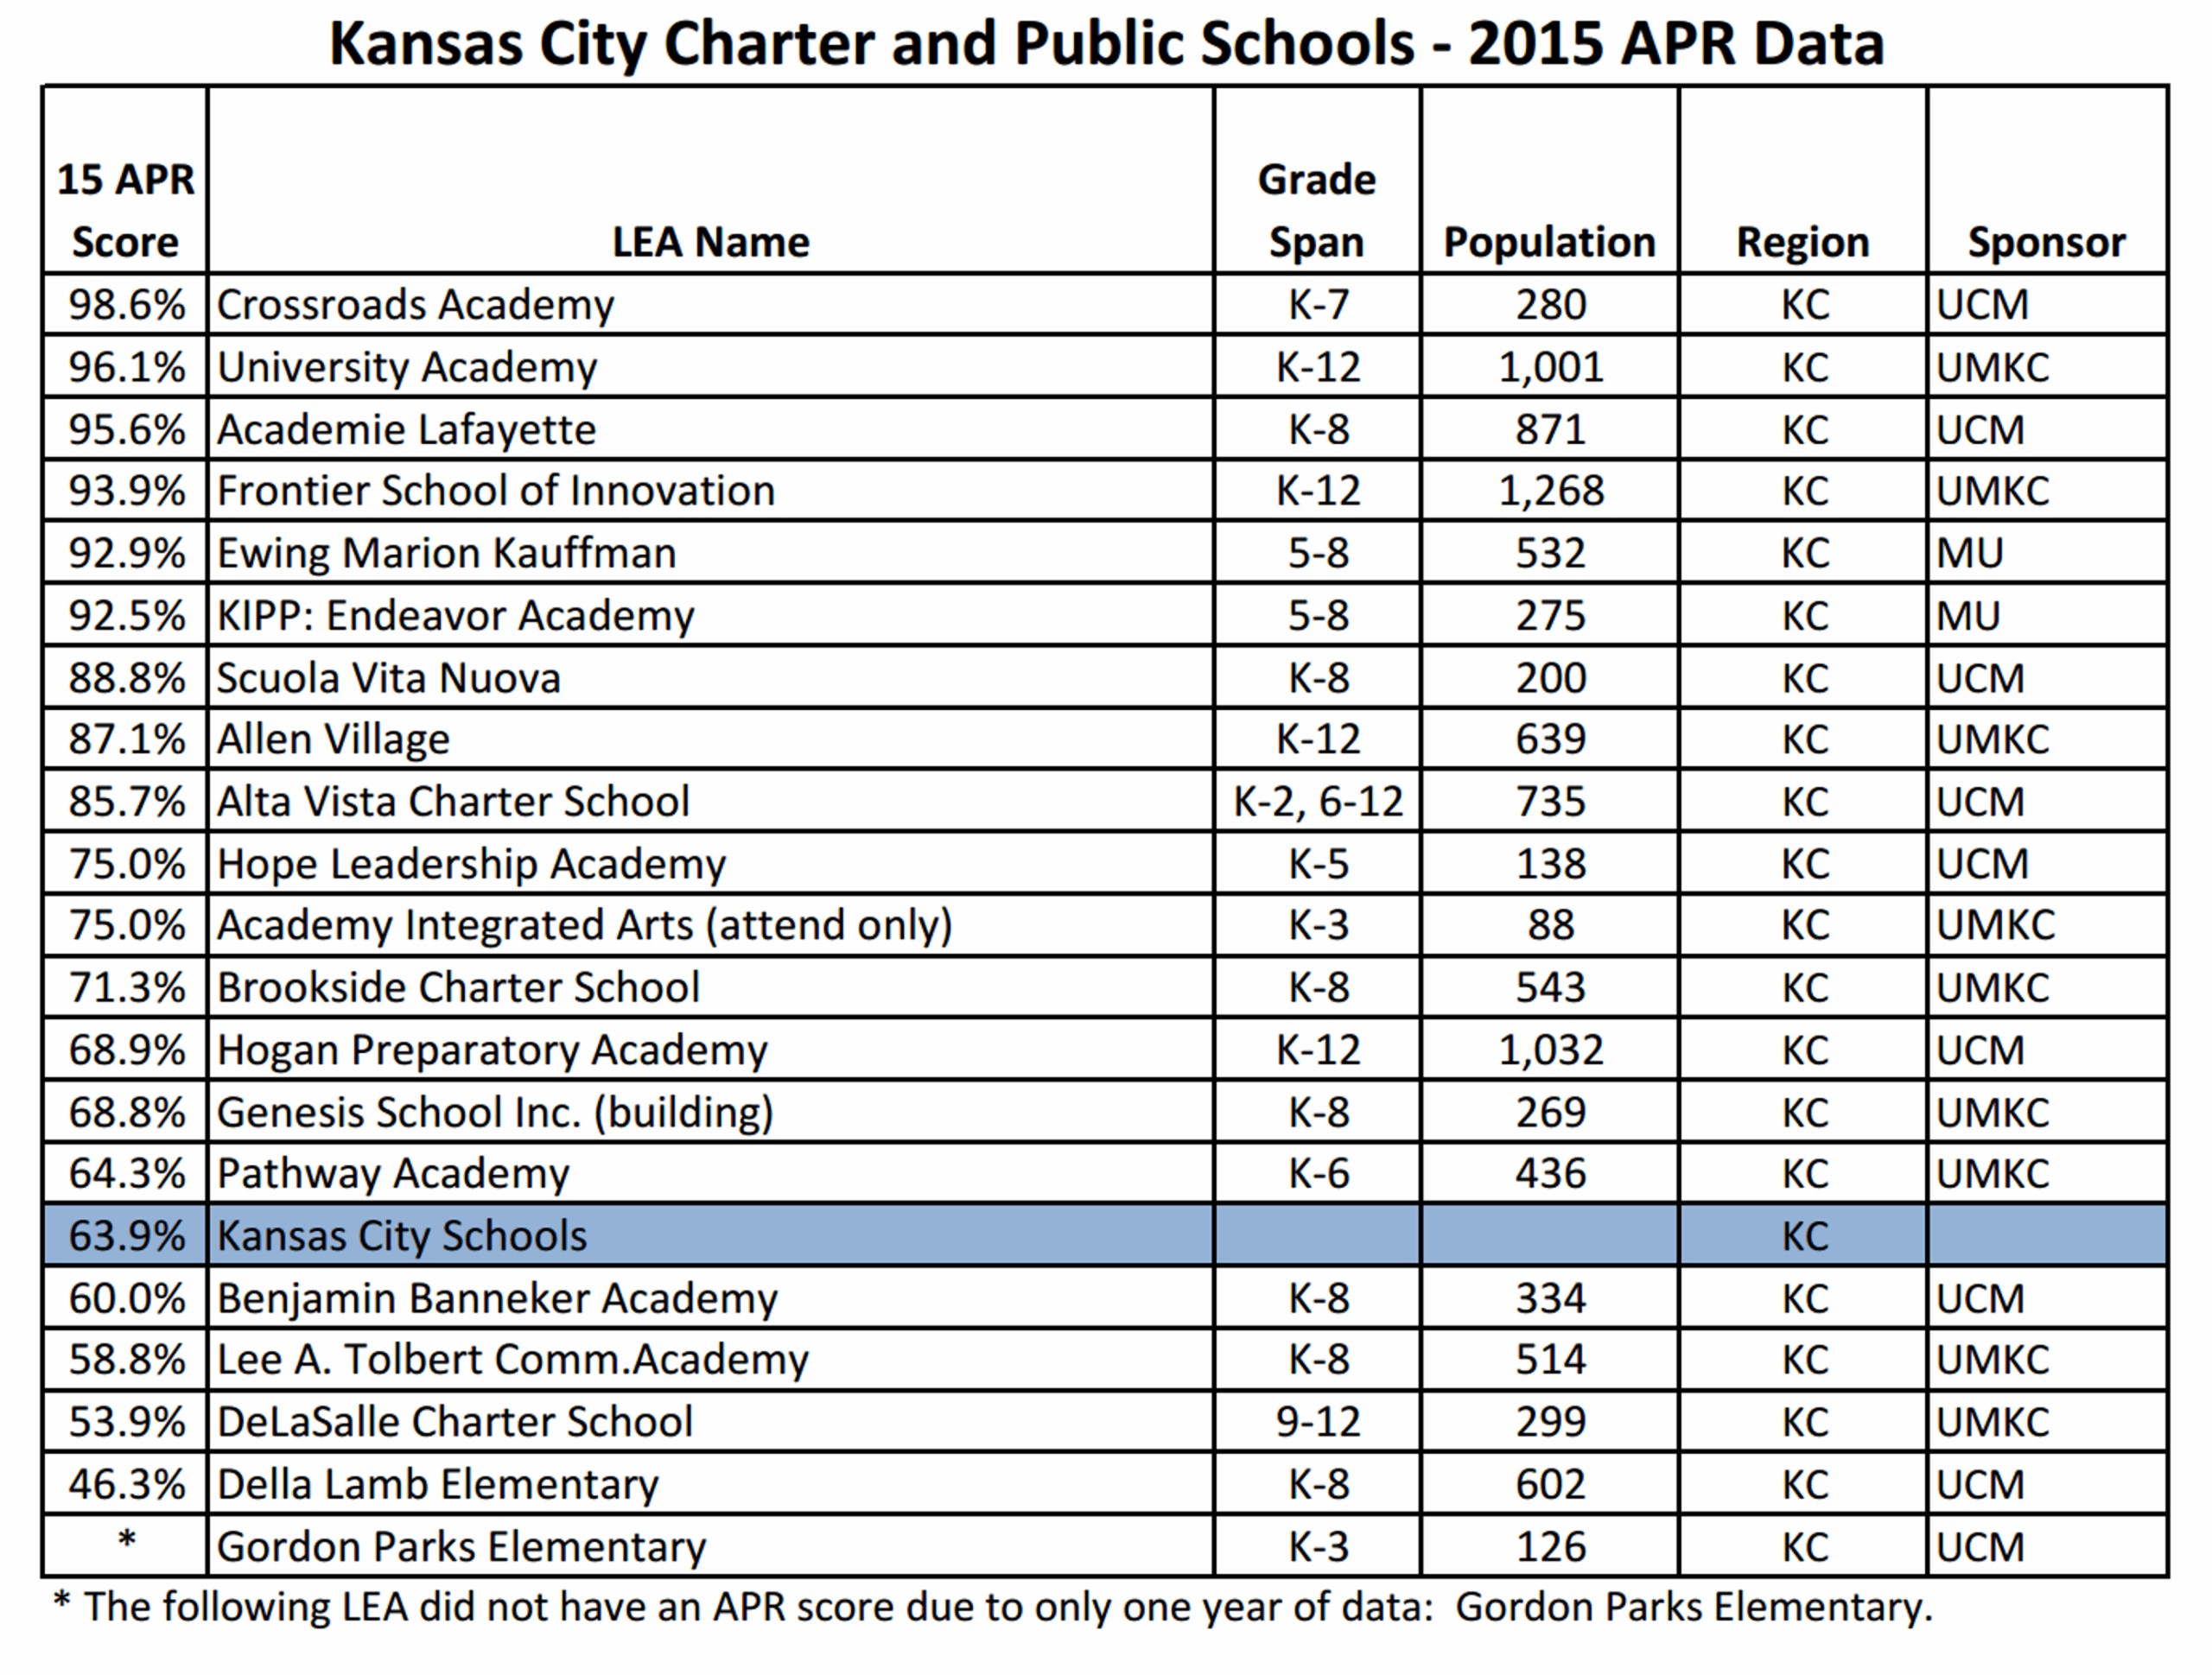
How well did these schools perform? Take a look below at the 2015 Annual Performance Report scores for charter schools compared to traditional public schools (for context, 70 percent is required for full accreditation):

Sources: DESE St. Louis Academic Performance Data, DESE Kansas City Academic Performance Data

On average, charter schools in Kansas City tend to be higher-performing options than the traditional public school district. In Saint Louis, the results are more varied, but there are several charter options that perform as well as any school in the state.

The following tables show demographic characteristics of students in the top 5 schools in Saint Louis and Kansas City.

Saint Louis's Top 5 Charter Schools

% Asian % Black % Hispanic % Multiracial % White
City Garden Montessori 0 40.3 5 4.1 49.8
North Side Community School 0 98.6 0 0 0
St. Louis Language Immersion School 1 55.1 8 3 32.4
Premier Charter School 7.8 27.1 13.8 7 44
Grand Center Arts Academy 1 61.5 3.2 4.5 29.4
Kansas City's Top 5 Charter Schools % Asian % Black % Hispanic % Multiracial % White
Crossroads Academy 2 40.7 18.9 0 32.7
University Academy 0 97.4 0.7 0 0.8
Academie Lafayette 2.9 16.2 4.7 7.8 68.1
Frontier School of Innovation 1.4 15.8 74 0.5 8
Ewing Marion Kauffman 1.4 84 5.4 3 5.1

As you can see, several of the top-performing charter schools in the state (Northside Community School, Saint Louis Language Immersion, and Grand Center Arts Academy in Saint Louis and University Academy and the Ewing Marion Kauffman School in Kansas City) serve student populations that are more than 50% African-American. Does the NAACP really want to deny students the opportunity to attend schools like these?

Of course, charter schools should be monitored closely for their performance and closed if they are failing. Such was the case of Better Learning Community Academy, which had an APR score of 28%; it is now closed.

If new and better charter schools are not allowed to take its place, however, then parents are left with fewer quality alternatives to their neighborhood public schools. Instead of taking away future opportunities, isn’t it better to enhance the education of students, regardless of race, to give parents more choices and more control over their children’s education? The evidence would say so.

The Dismal Recovery

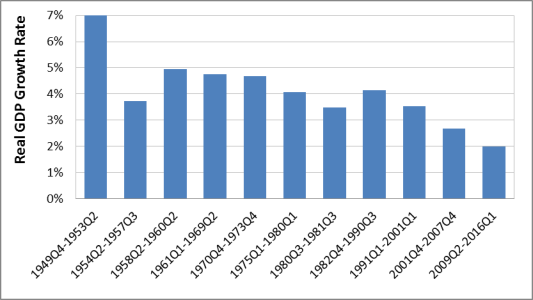
The “recovery” of the last seven years remains the worst in postwar American history. Average gross domestic product (GDP) growth since the bottom of the recession in 2009 was barely above 2.1% per year. The average since 1949 is well above 4% per year during the previous 10 expansions.


GDP Growth during the Expansions of the Post-WWII Period

Source: CRS calculations based on data from the Bureau of Economic Analysis (BEA).

Note: Economic expansions as identified by the National Bureau of Economic Research.


This result is not just bad—it is catastrophic. The average American should not be wondering if his income is a bit above or below 2007 levels. Just by historical averages, the average American should be 20% better off than in 2007. And this slow growth is settling in as a permanent new-abnormal.

I believe the root cause of abysmal growth is the huge tax increases imposed by President Obama and Congress since 2008. The most harmful were the increase in the capital gains tax from 15 to 20 percent, the increase in top bracket income from 35 to 39.6 percent, and the new tax of 3.8 percent on investment income in the Affordable Care Act (ACA). The massive increase in regulatory burden through the ACA and Dodd-Frank bills are also crushing, but unfortunately are harder to measure.

The three tax increases mentioned above (plus higher state and local taxes) directly lower expected returns on all investments. Our government grabs the fruits of investment and then is puzzled when businesses do not invest. This causes billions of dollars of investment projects to come off the table.

Weak investment is the signature feature and cause of the abysmal "recovery" under President Obama. The aggregate of all investments in the United States is Net Private Domestic Investment (NPDI), computed by the Bureau of Economic Analysis. Relative to GDP, NPDI averaged 7% per year from1960 to 2008. The average was 7 to 8 percent from 1960 to 1990, and 6.5 percent in the Clinton and George W. Bush years. However, for the Obama years NPDI was an astoundingly low 2% of GDP!

In every year of Obama’s presidency but 2015, NPDI was worse than in any year from 1960 to his inauguration. This isn't bad luck. If nothing changed in the economy, the likelihood of having a period as bad as Obama’s just by chance would be 1 in 1000.

The numbers for GDP and NPDI are interesting, but they’re still just lifeless statistics. The human toll is terrible, taking the form of millions of Americans who can’t find jobs or can’t make ends meet in the jobs they do have.

Dismal investment levels are the predictable result of taxing investment and income at high rates. This terrible economic performance will continue until income and investment taxes are slashed. The government can still raise needed revenue with a broad-base approach, eliminating all the special deductions and credits and allowing very low rates.

On the other hand, maintaining the current high rates will entrench lackluster investment and stagnant incomes and trap far too many Americans in a bleak economic future.

Regarding the American Royal’s Move to Kansas

On Tuesday, the American Royal Association announced that it would be moving from its longtime home in Kansas City, Missouri's West Bottoms, to Kansas City, Kansas. The decision follows several years of debate about the future of Kemper Arena and comes as little surprise to folks who have been following the issue. As I and others suggested might happen, the Royal's decision to jump to Wyandotte County came with a massive, $80-million financial assist from the state of Kansas. That sum will finance about half of what has grown into a roughly $160-million project.

There will be lots of analysis on the impact of the Royal project on Kansas from folks who follow their issues more closely. I'll punt those analyses to them, except to say that we continue to oppose the development culture, no matter the state, that treats taxpayers as cows to be milked for every big government idea that comes down the pike. Indeed, Kansas City's border war has cost both sides hundreds of millions of dollars over the past few years—money that won't be going to necessary public services in the region.

Meanwhile in Missouri, the rush appears to be on to dream up new ways to compensate for the Royal's departure from the West Bottoms, no doubt to be driven by more government largesse. Kemper Arena seems set to receive massive tax subsidies as it's turned into a youth recreation complex. What, if anything else, gets built around that remains anyone's guess, though chances are good that those projects will be subsidized by taxpayers, too. We continue to oppose such a development plan. Of the things the City could and should do in the West Bottoms, not letting the City's own sewage treatment plant continue to stink up the area and its surrounding neighborhoods would be a good start. We'll see what actually happens.

To many of us, the Royal represented one of the signature cultural events that made Kansas City unique. In a time where municipal me-tooism is all the rage, the Royal stood out as a sign that Kansas City, though changing, is still connected to her past. Its departure is a loss for Kansas City, Mo., and serves as a sad commentary on a tax-incentivized development culture run amuck in this region. 


Chart: 2017 Obamacare Premiums in Your County

Earlier this week the Department of Health and Human Services released next year's Obamacare insurance exchange prices. You can find the full data set here; I have set aside Missouri's rates in the spreadsheet embedded below. To find the range of rates and plans that will be available to you, press CTRL-F (or Open Apple-F on a Mac) to open the search function, and then input your county. As you scroll right, you'll find the range of prices in your county, sorted by demographic.

Support Us

The work of the Show-Me Institute would not be possible without the generous support of people who are inspired by the vision of liberty and free enterprise. We hope you will join our efforts and become a Show-Me Institute sponsor.

Donate
Man on Horse Charging