Since the passage of the Affordable Care Act, public welfare and healthcare state spending have become the largest contributors to Missouri’s general expenditure growth. Public welfare spending by itself, which includes Supplemental Security Income, Temporary Assistance for Needy Families, and Medicaid, now accounts for 34 percent of growth in Missouri’s general expenditure spending since the recession ended.
For most states, education remains as the biggest slice of pie for general expenditures, and for Missouri this is still the case. However, education is no longer the strong magnet of state dollars it once was.
The table below, from the U.S. Census Bureau, shows that while education still commands the largest share of Missouri’s general expenditures, spending on public welfare has increased at a faster pace than spending on education since the 2008 recession.
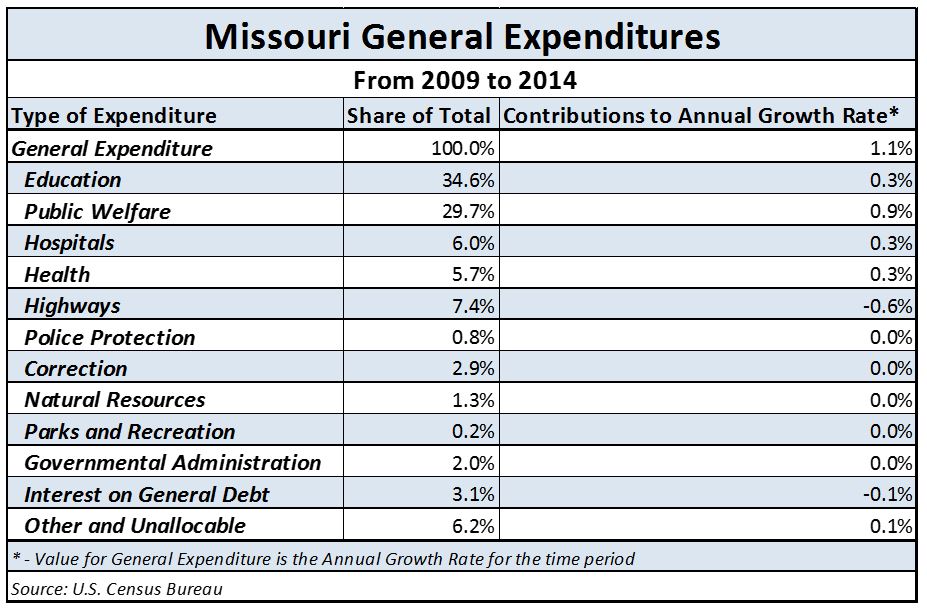
Some takeaways from this table:
- Education expenses are almost 35% of total expenditures, but only grew (on average) by 0.3 percentage points annually from 2009 to 2014.
- Public welfare expenses make up nearly 30 percent of total expenditures, but are the biggest culprit in the growth of total spending, with expenses rising at an annual rate of 0.9%.
- If we combine public welfare spending with Hospitals and Health spending, then spending on healthcare and social assistance would account for 42 percent of general expenditures.
As we approach the 2017 legislative session, these trends in spending can inform policy decisions. If public welfare spending growth continues unabated, other services—like education, transportation, and public safety—might find dollars increasingly hard to obtain.