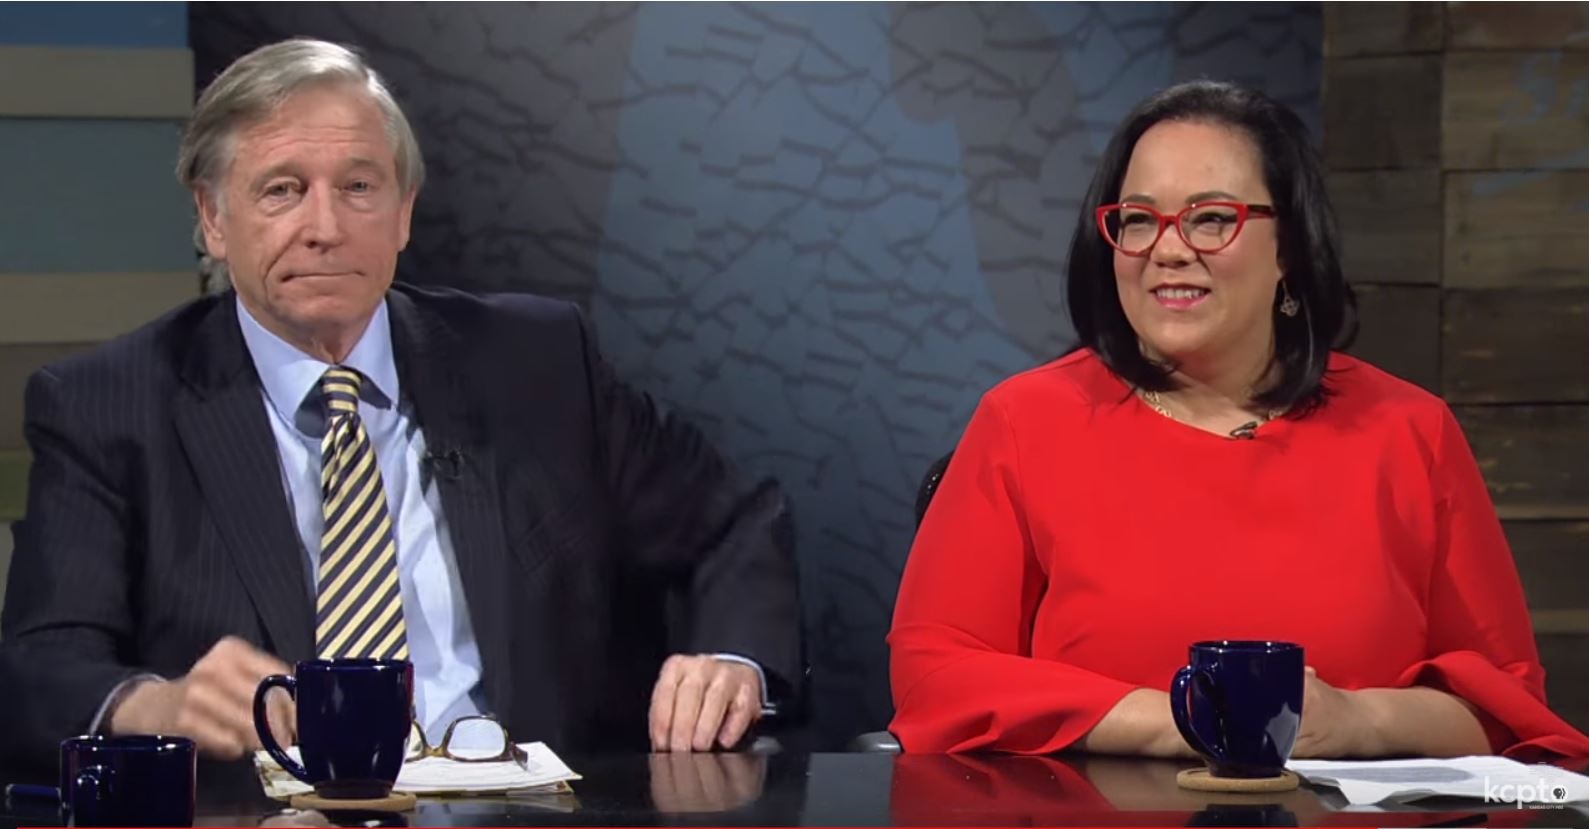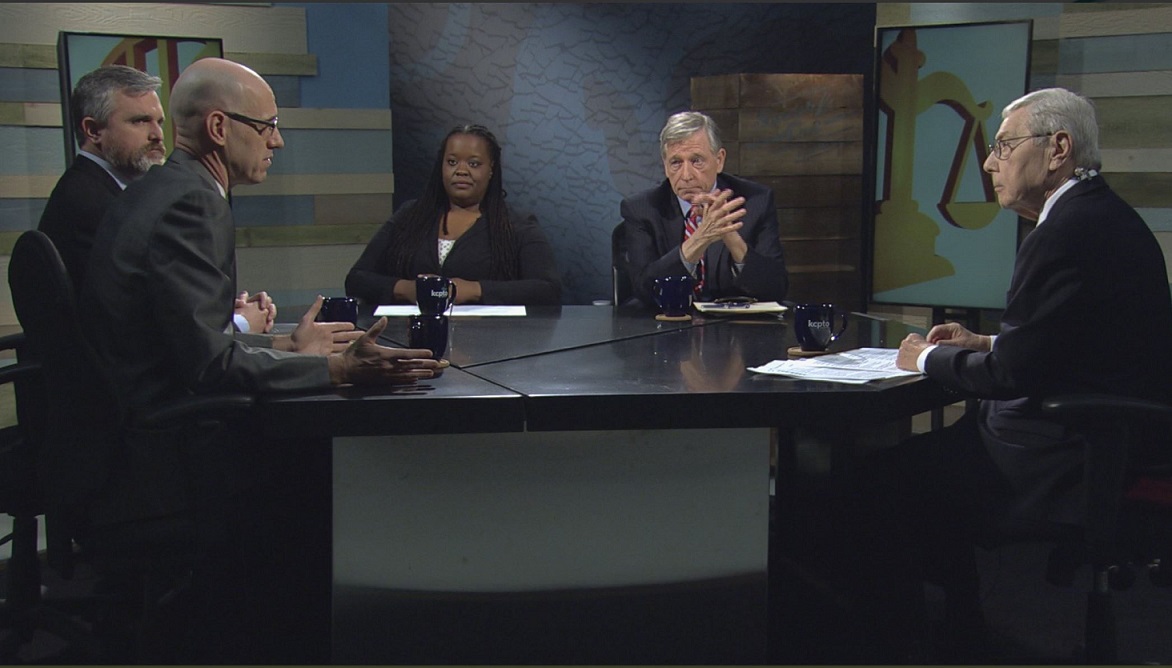
Show-Me Institute’s Crosby Kemper III and Patrick Tuohey discuss ongoing problems in Jackson County, the merger of Sprint and T-Mobile, and other state and local issues.

Show-Me Institute’s Crosby Kemper III and Patrick Tuohey discuss ongoing problems in Jackson County, the merger of Sprint and T-Mobile, and other state and local issues.
A few weeks ago I asked the question, “school administrators, what did you spend your money on?” The purpose of that piece was to show that Missouri has been increasing school funding, but that money has not translated to higher teacher salaries. I showed that much of the money went to additional people, such as aides and administrators, and some went to increased costs for benefits. A recent audit of the Hazelwood school district offers even more answers. The St. Louis Post-Dispatch has the full story, and I suggest you check it out.
Here are some of the highlights:
The audit noted that the School Board and superintendent spent more than $387,000 in the past two school years on membership fees, travel, gifts, airfare and meeting expenses. The district spends tens of thousands of dollars on items such as sympathy flowers, sympathy cards, “excessive tipping,” bellhops, valet parking, extra airline fees, gifts, T-shirts and board meals.
That’s enough money to give every teacher in the district about a $300 raise. That may not seem like much, but things like this add up. Here is another example from the Post-Dispatch’s report:
The district pays a $600 monthly car allowance to the associate superintendent in addition to mileage reimbursement, even though the associate superintendent only drove $250 worth of mileage for the entire last school year.
According to data from the Missouri Department of Elementary and Secondary Education (DESE), the average administrator in Hazelwood earned $107,526 in 2017. This includes principals and assistant principals, so the salary paid to an associate superintendent is undoubtedly higher than this. I leave it to you to decide whether a $600 monthly car allowance for an associate superintendent is a prudent investment for the district to make.
The audit also found that the school district improperly over-counted student attendance—leading to the district receiving $95,000 that it wasn’t supposed to receive—and failed to report a principal who allegedly stole thousands of dollars from the district. While those two examples are evidence of wrongdoing, what about the spending practices described above? They don’t violate any rules, but they explain a lot about where all that additional education funding is going. In a time of increased focus on teacher pay, it seems incredible that we can say to school administrators, “That’s what you spent your money on?”
[As part of the Show-Me Institute’s Checkbook Project, you can see a full breakdown of the Hazelwood School District’s spending.]
Last week the Show-Me Institute released a new essay that discusses the importance of tax reform. Many of the ideas in the essay have appeared in state legislation this year and in previous years, but unfortunately, it remains unclear whether the two most prominent tax reform packages—one from the House and one from the Senate—will ever actually become law.
That doesn’t mean that nothing should be done on taxes this year. In fact, a bill that would reform the state’s corporate income tax, sponsored by Sen. Andrew Koenig, has emerged from the Senate and is now before the House for consideration. The bill, Senate Bill 674, represents good policy pursued on a revenue-neutral basis, and while the legislation could be imagined as a “side car” to comprehensive tax reform plans, the bill itself is a strong standalone measure that would drastically reduce the state’s corporate income tax rate.
Cutting the corporate income tax is a cause near and dear to my heart and, with my colleague Michael Rathbone, it was the subject of one of my first essays at the Institute in 2012. That essay dove deeply into the importance of corporate income tax reform and some ways to achieve it, drawing on the broad academic consensus about the economic destructiveness of income taxes. To quote researcher Jens Arnold of the Organisation for Economic Co-operation and Development,
[a] stronger reliance on income taxes seems to be associated with significantly lower levels of GDP per capita than the use of taxes on consumption and property. Within income taxes, those on corporate income seem to be associated with lower levels of GDP per capita than personal income taxes. In fact, corporate income taxes appear to be the least attractive choice from the perspective of raising GDP per capita. [emphasis mine]
That’s why SB 674, even on its own, is important. Thus, the concern here—and a concern shared by the Washington D.C.–based Tax Foundation—is not policy-specific, since the bill is a good one, but procedural. If SB 674 is amended in the House, chances are good that the bill would simply die as the legislative session comes to a close, since the Senate would have to reconsider it and time is obviously running out.
I think most reformers would want to see reform come all at once, and in truth, there is no reason why over the last two years that couldn’t have happened on tax reform. But there is something to be said for methodical incrementalism, and I hope that serious consideration will be given to the subject of corporate income tax reform on its own terms as a springboard to larger reforms, passed this year or in the near future.
After two years of missed opportunities, it would be excruciating to see another opportunity for reform vanish at the end of this legislative session. I hope the House doesn’t let this happen.
In a recent blog post about the state of affairs in a couple of Missouri state pension funds, we pointed out that they’re getting costlier and less sustainable with each passing year. Sadly, the systems serving the teachers in our two major cities are even worse. According to a 2017 asset/liability analysis commissioned by the Kansas City Public School Retirement System (KCPSRS), that system is currently only 64 percent funded, partly because the school district has failed to make the required contributions since 2012. At the current contribution rate of 19 percent (9.5 percent from the teachers/9.5 percent employers—either the Kansas City Public School District or a charter school), assuming the fund will earn a 7.75 percent return every year for the next 20 years, the system will be 53 percent funded in 10 years and just 39 percent funded in 20 years. (If the fund earns just 4.75 percent per year, the funding ratio in 2037 will be . . . 0 percent. That’s right—no money left in the fund.) Not surprisingly, the KCPSRS has requested that the state legislature increase the school contribution to 10.5 percent next year and 12 percent in the following year. In the best case, a total of nearly 22 percent of payroll will be contributed to the KCPSRS and the fund will earn a consistent return of 7.75 percent every year for 20 years, which would get it to 80 percent funded.
The St. Louis Public School Retirement System (STLPSRS) has its own problems—it was just 64 percent funded in 2016, with 5,000 current teachers supporting 4,600 retirees. Teachers have been contributing 5 percent of payroll, with St. Louis Public Schools (SLPS) and charter schools making up the rest of what the annual actuarial analysis determines is necessary to keep it funded at least 70 percent. As a result, the bill for SLPS and the charter schools has climbed to over 15 percent and, in 2018, the actuarial analysis determined it needed to be 19 percent. However, difficulty keeping up with increasing costs led SLPS to request that the Missouri state legislature cap their contribution rate at 16 percent. In addition, teacher contributions would climb by one-half percent each year until they reach 9 percent (new teachers in fall 2018 will immediately begin paying 9 percent). According to STLPSRS, that would leave them with a $192 million shortfall within 15 years, so they’re suing SPLS and the St. Louis charter schools.
Economic conditions, unaffordable benefit promises, and an unwillingness to use realistic investment return assumptions have resulted in precarious fund positions, lawsuits, and attempts to balance the books on the back of the youngest workers. Does it have to be this way? No. Many states are moving away from defined-benefit plans (pensions) and toward defined-contribution plans [like 401(k), cash-balance, or hybrid plans]. In some cases, all new employees are placed in the new plans; in others, they can choose between the state defined-benefit plan or the new options.
We’re also seeing teacher retirement benefit innovation from within public education. In 19 states, charter schools may choose whether or not to participate in their states’ pension plans. A recent analysis of charter school participation in five states that make participation optional found that the schools most likely to opt out of the state plan are urban, elementary schools, and those that are managed by charter networks. Most of the opt-out charter schools offer their teachers 401(k) or 403(b) plans, and the teachers are vested in less than one year. The reasons given for choosing this path were mostly that the schools wanted to lower their estimated costs, give teachers a wider range of investment options, and make their teacher benefits more portable. For today’s youngest teachers, this is an important point. Most of them will not meet a vesting period of ten years in one state and, when that happens, they lose the amount that their employer contributed for them.
The good news for teachers and taxpayers is that there is time to protect current and future retirees before the system is bankrupt. The building isn’t on fire yet. However, those of us who pay close attention to this complicated topic are starting to see smoke under the door. It’s time to start talking about how to stabilize Missouri’s teacher pension systems.
Today my colleague Patrick Tuohey and I are proud to announce the publication of our latest essay, “A New Tax Policy Vision for Missouri.” While the Institute has a vast body of work that often addresses state and local taxation as separate topics, this new essay takes a more comprehensive approach to the subject, in light of recent debates, and deconstructs the tax issue—an approach we hope will help encourage tax reform around sound principles of good governance. As we say in the introduction,
Taxation requires a taking, with or without the consent of the individual. Because it is a taking, the debate about taxes—about how much money should be drawn from private enterprise, in what manner, and for what purpose—is among the most important debates in which policymakers engage. With that in mind, we must carefully consider what public goods are so vital that we must impose taxes to fund them. How much taxation is fair? And who is to pay it?
Specifically the essay grapples with income tax policy, state and local tax incentives, and the appropriate provision of government services such as roads. We hope that this more basic and holistic approach to the tax policy questions that face policymakers is informative and digestible to laypersons and experts alike. Click on the link below to read the entire essay.
Earlier this month Atlanta mayor Keisha Lance Bottoms announced the launching of the city’s own municipal checkbook in order to show citizens how the city is spending their money. Atlanta joins the group of cities across the nation that have made their spending information available in an open portal online, including New York City and San Francisco, along with local examples of Kansas City, St. Louis City, Chesterfield, and Ballwin, all of which have their spending records posted on their websites.
As you may know, a few months ago the Show-Me Institute launched its own municipal checkbook project in an effort to increase government transparency and accountability. Our database tracks the spending of local cities. Missouri taxpayers ought to be able to see how their cities spend their money, and we hope more of our municipalities follow Atlanta’s lead by making a municipal checkbook a top priority.
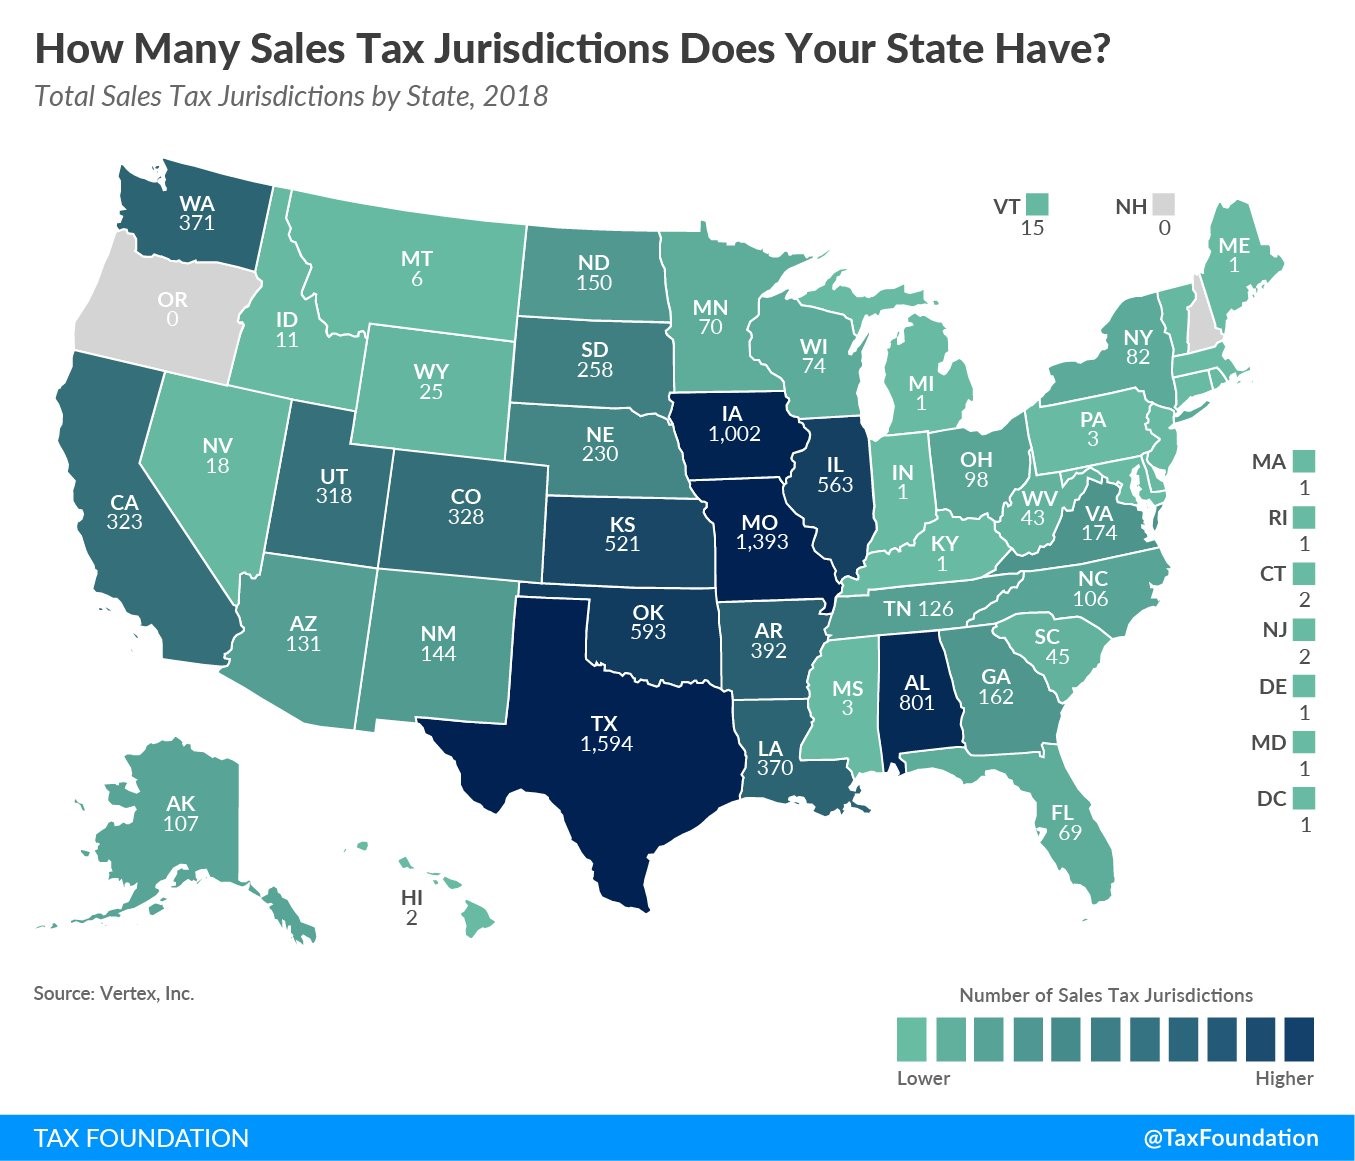
Taxes. They’re high. They’re regressive. They’re inefficient. And in Missouri there are too many of them.
None of this is to say that taxes are unnecessary or even bad. Taxes are necessary to fund the basic services we all agree are the responsibility of government. But Missouri can do better. A report from the Tax Foundation released last week underscores the point. According to the Tax Foundation’s count, Missouri has 1,393 sales tax jurisdictions, second only to Texas.
This staggering number is due to special taxing districts such as community improvement districts, transportation development districts, and the like. These districts are easily established and are often not open and transparent. Many were established without a public vote. Yet each has the power to tax us on each purchase.
One effort to cap the sales tax rate in Missouri at 14 percent is making its way through the legislature. But if the proliferation of special taxing districts itself is not addressed, the general assembly risks ceding its influence over tax policy to an ever-growing number of tiny fiefdoms.
The Show-Me Institute’s Chairman Crosby Kemper III appeared on KCPT’s Ruckus on Thursday, April 19, to discuss the future of the failing American Jazz Museum and a recent march pushing for local control of the Kansas City Police Department.
The American Jazz Museum in Kansas City is a failure, as is the entertainment district in which it resides. It is an expensive failure. As we’ve written previously, all of this was foreseeable, and was foreseen, when the 18th and Vine District was in its infancy. Our government-funded jazz district is in shambles, while the privately financed Beale Street in Memphis is soaring.
According to a story from KCUR, a consultant’s report on the Jazz Museum was scathing:
The museum, according to the consultants’ report, is “in need of complete rethinking, akin to starting a new museum.” The report called for a “complete rebirth, starting with its leadership, but continuing with a revamped financial model, visitor experience, and operational infrastructure.”
Among the consultant’s 26 recommendations was to close the museum for a period of time. Again from the KCUR story:
Five recommendations involve immediate action, including the closure of the museum “for a predetermined period of time.” A temporary closure for less than a year, the report said, would allow the organization to “save costs and focus on basic operating needs.”
I am no museum consultant, but that seems like pretty good advice to me. In fact, it was exactly the advice I offered on KCPT’s Ruckus back in October 2017. City leaders may prefer to ignore the advice of the report and further involve government management and taxpayer subsidies. Doing so would be a shame.