Video: An Ode to the “Ditch Diggers” Building Missouri

The video above—which you’ll notice was largely produced here in Kansas City—has been out for a few months, but “broke out” in construction circles on social media in the last week or so, which is how I came across it. The video is about workforce development, which I’ve written about before, and revolves around a poem titled “Ditch Diggers” by Eric Borden, a Drexel, Mo., resident. It focuses on the often-negative view that modern culture has for good blue-collar professions, and Borden uses the term “ditch diggers” as shorthand for a variety of professional vocations in construction and other blue-collar industries. In addition to being relevant to policy discussions, as a poem it’s a form of art as well. 

As I’ve said before, state workforce development policies have to encompass the spectrum of professions in Missouri rather than just prioritize college educations, and the “Ditch Diggers” poem and video help to give human faces to the argument.

State Auditor Calls for CID Reform

Having completed a soon-to-be-released paper on Missouri’s profligate special taxing districts such as transportation development districts (TDDs) and community improvement districts (CIDs) with Graham Renz, I was pleased to see this news from the office of the Missouri State Auditor.

CIDs are designed to meet local needs by giving businesses and individuals and opportunity to band together to collect an additional sales or property tax to fund specific projects. However, the statutory requirements are lax and oversight is wanting.

According to the August 22 news release,

“Taxpayers are on the hook for billions in project costs they did not approve and have little to no say in,” Auditor Galloway said. “Meanwhile, there is no law to ensure developers are accountable for the public dollars they receive and there are few requirements of the municipalities that approve these districts. State laws must be reformed to ensure taxpayers get the protection they deserve.”

The complete Auditor’s report is available here. We welcome the Auditor’s contribution and look forward to joining this important policy discussion with our own policy recommendations soon.

Marketing Water?

It might not surprise readers to learn that government bureaucrats overspend. But the Kansas City Water Services Department spent a great deal of money on a video promoting . . . water.

Back in the summer of 2013, the Water Department sought to “produce an educational video focused on the journey Kansas City’s water takes from river, to tap. [sic]” The resulting 1:44 video, embedded above, cost $24,541.28.

By way of comparison, the 25-minute Kansas City Public Television documentary, “Water Rates and Rivers,” which explored the steep increase in water rates and its serious impact on the poorest among us, cost about $40,000. Not only was the KCPT video nearly 15 times longer, but it required much more time and effort to produce.

About the time the contract to produce the Water Department video was signed, Mayor James declined a request by the Missouri Auditor to look into the department due to complaints his office received. Given ever-increasing water rates and this questionable expense, perhaps that decision should be revisited. In the meantime, I invite you to tap your toes to this bit of government-funded education.

State Checkbook Is Now Online

Yesterday marked a step forward for transparent government in Missouri. The Missouri Treasurer’s Office announced the creation of an online checkbook that tracks how and with whom the state is spending our tax dollars. The Show-Me Checkbook can be found at https://treasurer.mo.gov/showmecheckbook.

We are excited to see the state make transparency in spending a priority. Now that this tool is available, I hope that local governments and special taxing districts will join this initiative so that every tax dollar spent at all levels can be tracked by the taxpayers from whom the money comes (a goal SMI writers have championed with our Checkbook Project).

Government, no matter its size, should provide easy access to information about how it’s spending our money. Kudos to Missouri for taking a step toward greater transparency.

Introducing the Show-Me CBAs Project

Following the passage of HB 1413 and in light of the success of our Checkbook projects, we are pleased to share with you our latest “big data” undertaking, the Show-Me CBAs Project. For those unfamiliar, the Missouri legislature passed HB 1413 earlier this year to reform much of the state’s public sector labor laws. Part of the bill sets out clear rules for how collective bargaining agreements, or “CBAs,” are to be negotiated between government and many unions. Those CBAs often set forth the salary and benefits of employees who aren’t even members of the union and who may, instead, want to negotiate their own salaries based on merit; for some of these employees, HB 1413’s CBA rules could functionally offer them that opportunity.

One big problem, however, is that many of these agreements are effectively unknown to the public, and to date there hasn’t been a concerted effort to gather these local agreements and their variations, including memoranda of understanding and other, less-formalized agreements between labor organizations and government. Hundreds of these agreements could be out there, and yet research in this area is surprisingly sparse.

That’s where the Show-Me CBAs Project comes in. By gathering these bargaining agreements, we hope to make it easier for the public to see what their elected representatives have committed taxpayers to in the past, In addition, the Project can also make compliance with HB 1413 an easier undertaking both for government workers and for government regulators charged with implementing HB 1413’s reforms. This project is ongoing, and to date, the Institute has already gathered over a hundred bargaining records, available here. But more are on the way. Stay tuned.

What Will the City’s New MetroLink Tax Get Us?

Last year, voters in the City of St. Louis approved a rather ambiguous half-percent sales tax hike, Proposition 1. Sixty percent of revenues from that tax, which totaled $23.9 million this past fiscal year (p. 49), are slated to fund a north–south MetroLink expansion.

But who knows what city taxpayers will end up getting for their “investment?”

Taxpayers likely won’t get the 17-mile route they were presented last year. After more than a year of study, it was recently announced that the first phase of expansion will run some 9 miles, roughly from Chippewa St. to the NGA site north of downtown, and will cost $700 million. The project is also totally dependent on federal funding, which is a big if at this point, and will begin operations, best case scenario, in a decade.

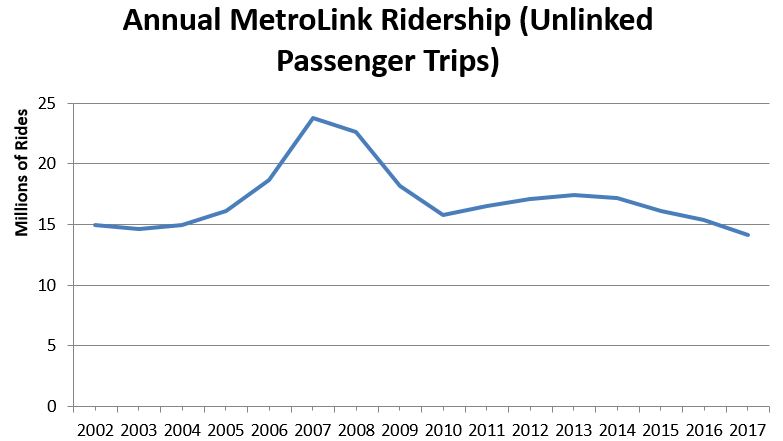
It’s also unclear whether the expansion will get St. Louisans out of their cars. While consultants project the line will carry some 9,200 riders a day, my colleague Joe Miller has pointed out that it runs through neighborhoods with relatively low population density—density about a quarter of what’s needed for light-rail to be successful. Also, overall MetroLink ridership is trending downward; not only has it lost 3.9 million annual rides since 2014, but the rail system carries fewer passengers than it did prior to the 2006 Shrewsbury expansion. And crime on and around MetroLink trains has, according to Metro, contributed to an 11% decline in ridership since last year. While I don’t doubt that an expanded system will (at least initially) carry more passengers, experience—and more than 15 years’ worth of data—suggest we shouldn’t get our hopes up.

MetroLink Ridership

Source: National Transit Database, Federal Transit Administration

But perhaps the biggest if is the economic renaissance promised by MetroLink officials and proponents. Transit advocates claim that rail spurs economic development, that, once you put the rails in, the traffic generated by riders will induce all sorts of business growth. Unfortunately, this claim just doesn’t hold up. Many MetroLink stations are surrounded by land that’s either (a) already developed (and likely heavily subsidized), or (b) relatively empty. In fact, transit-oriented and adjacent development is so scarce in St. Louis that rail advocates have to cast an incredibly wide net for any evidence of it. For instance, Citizens for Modern Transit, the region’s major transit advocacy group, includes investments on Interstates 64 and 70 and parking garages as development “spurred” by MetroLink. And Metro, which operates MetroLink, seems to think any investment within a half-mile of a rail station is causally linked to the presence of their trains. (Or, all they present is data on development within a half-mile of their stations.) Perhaps this is why consultants are now saying that MetroLink could “spur possibly millions of dollars in economic development….” (my emphasis).

At this point, it’s unclear what, if anything, taxpayers will get in return for hiking up their sales taxes. Although rail proponents may have inexhaustible faith, history and facts suggest taxpayers won’t get much for their investment.

Time to Take out the Trash

On the heels of a report finding that St. Louis has some of the poorest-quality city services in America, residents have criticized the city for falling behind in trash collection, and the problem continues to pile up. This situation quite literally stinks. How did we get here?

Originally, the city paid for solid waste collection from ordinary tax revenues. However due to budget constraints—maybe due to the city giving away hundreds of millions of dollars in tax subsidies—the Board of Aldermen passed a bill in 2010 to implement an $11 monthly fee per household to help cover refuse costs. Last August, the Board voted to increase the fee to $14. The additional money was for, among other things, obtaining new garbage trucks to “ensure garbage collectors won’t be forced to work overtime because they’re stuck with poorly functioning trucks.”

And what have the results been? The city’s fleet of garbage trucks continues to deteriorate. Roughly half of the 84 trucks are in disrepair, leaving the other half to cover the 55 daily routes. Even with extended hours and 12 new—leased—trucks, the city still lacks the resources to pick up the trash on time, so the dumpsters continue to overflow.

We are not suggesting that the problem here is exclusively the fault of city officials. For one thing, piles of uncollected garbage don’t make for good optics if you’re an elected official with constituents to keep happy. And the decision to lease new trucks rather than buy them looks like a reasonable response from a city that is behind on maintenance for the trucks it already owns.

Maybe the larger issue is that garbage collection is a better fit for private companies than for a city government. Privatizing this service would allow residents to choose their garbage collector, unlike now, creating competition among service providers and incentivizing high-quality, efficient operations. Wichita, Kansas, a city with 80,000 more people than St. Louis, has no city-run solid waste collection system. The average household in Wichita spends $25 per month on garbage collection. (In comparing this rate to costs in Saint Louis, keep in mind that St. Louis’s current $14 per month fee is in addition to the money from the overall city budget that goes toward trash collection.) As for the quality of service provided, we can’t claim to have our fingers on the pulse of the Wichita trash-collection scene, but our internet searches yielded nothing like this or this or this in Wichita.

Maybe it is time to see if the private sector has an answer to this embarrassing—and smelly—problem.

Kansas City Fails to Meet Goals Set by 1968 Report

Immediately following the assassination of Dr. Martin Luther King, Jr. and riots in Kansas City, Mayor Ilus “Ike” Davis appointed the Mayor’s Commission on Civil Disorder to examine events and suggest changes. Reading the commission’s report 50 years to the week after it was issued is an unpleasant reminder of how little progress has been made.

The report examined “the severe civil disturbance that occurred in Kansas City during the week of April 8, 1968 and [made] a report to the people of Kansas City.” Among other things, the report contained recommendations for avoiding future riots and “for the establishment of harmonious relations among the people of this city.”

One of the areas examined was Kansas City’s police—their number, recruiting, training, and tactics. At the time of the report, Kansas City had 932 police officers and was facing reductions. On page 48 the report offers:

Instead of its police force being reduced, this city needs a total of at least 1,500 police officers. Even the existing statute contemplates two police employees for each 800 persons in the population. Since 1961 Kansas City’s population has increased by approximately 15%, and its land area has been nearly doubled by annexation. Expected police service has increased by 58%, but the number of law enforcement personnel has remained approximately the same as it was in 1961.

The commissioners’ call for more police to reduce crime is borne out by subsequent research. Yet Kansas City today has 1,283 sworn law enforcement officers, down 121 from the 1,404 officers they had in 2010. The city never achieved the 1,500 mark recommended by the commission’s report. Nor has the city successfully adopted the commission’s recommendation to rely more heavily on foot patrolmen—but that may be a function of not having enough officers.

Based on 2017 data, Kansas City has the sixth-highest homicide rate in the United States per 100,000 population. Based on FBI statistics, of the ten cities with the highest homicide rates, Kansas City has the fewest officers per 10,000 population.

A years-long, nation-leading spike in the number of homicides is arguably as “severe” a “civil disturbance” as one can imagine. Numerous factors are causally linked to crime, including education, poverty, and income inequality. Yet when it comes to the one aspect of public safety that policymakers can control, policing, Kansas City has fallen short of its 1968 goals.


More Reason to be Skeptical of Economic Development Incentives

If you’re hoping that a new report on Kansas City’s economic development incentives accurately assesses their value, I’ve got some bad news. Based on the draft copies of the always coming, never arriving report sent to me in response to an open records request, the report has one glaring and fatal flaw: It fails to address the much-maligned “but-for” analysis.

For a development project to receive tax-increment financing (TIF), one of the most popular subsidies, two boxes must be checked: A property must be declared blighted, and the proposed project must pass the but-for test. (We’ve written much about the largely meaningless blight standard before.) The but-for test, in short, is proof that a project wouldn’t go ahead in the absence of public assistance. Developers often support this claim by showing that a project would not be profitable without the public assistance, or in many cases not profitable enough for their tastes.

Much of the research on TIF subsidies in Missouri and around the country focuses exactly on that but-for analysis. Studies consistently find that TIF-treated areas grow economically at the same pace as non–TIF-treated areas. This means that cities are subsidizing development that is just as likely to happen without the subsidy—regardless of what the applicant tells you. TIF applications sometimes rely solely on the applicant’s own claim that without subsidies they would not build.

A new working paper from the Upjohn Institute for Employment Research underscores this exact problem in Kansas City when it concludes in part, “Overall, the research literature on incentives’ ‘but for’ effects is not as rigorous as one might hope.” No kidding. The paper sums up its findings as follows:

Based on a review of 34 estimates of “but for” percentages, from 30 different studies, this paper concludes that typical incentives probably tip somewhere between 2 percent and 25 percent of incented firms toward making a decision favoring the location providing the incentive. In other words, for at least 75 percent of incented firms, the firm would have made a similar location/expansion/retention decision without the incentive. Many of the current incentive studies are positively biased toward overestimating the “but for” percentage. Better estimates of “but for” percentages depend on developing data that quantitatively measure diverse changes in incentive policies across comparable areas. [Emphasis mine.]

If the draft report being passed around between the CDFA and Kansas City is any indication, not only does it fail to seriously analyze “but for” claims—unlike a similar study conducted in St. Louis—it barely mentions but-for whatsoever. That means we are being asked to assume that developments that come after subsidies are granted come because subsidies are granted—a basic logical fallacy. Kansas City leaders had the time and resources to commission a more thorough analysis of city incentives, and they chose not to. What they got instead was a report that mimics the failures of their policies.

Support Us

The work of the Show-Me Institute would not be possible without the generous support of people who are inspired by the vision of liberty and free enterprise. We hope you will join our efforts and become a Show-Me Institute sponsor.

Donate
Man on Horse Charging