Shared Emergency Dispatching Services

A version of the following letter appeared on Lakeexpo.com.

There is probably no better opportunity for municipalities to share services for public benefit than in emergency 911 dispatching services. Lake Ozark and Osage Beach deserve credit for considering this change, which can improve public safety and save taxpayer money at the same time.  Lake Ozark appears to be moving ahead with the necessary legislation, and Osage Beach should move forward with it as well.

In 2015, Lawrence County in southwestern Missouri began a process to consolidate and modernize all the 911 systems for its various agencies, including the county sheriff, nine municipal police and fire departments, fire districts, and ambulance districts. The municipality of Aurora stated that it would save $400,000 by joining the new, countywide 911 system and closing its own system. The combined system is currently investing in an upgraded 911 center to provide even better service to the county.

There are many more opportunities for 911 consolidation around the state and in the Lake region. Municipal police departments aren’t limited to sharing service with other police departments; they can operate together with fire districts, county sheriffs, university police departments, ambulance districts, and more. The economies of scale allow for greater enhancement of technology in larger 911 systems, and it saves taxpayer money, just like in Lawrence County and elsewhere in Missouri.

Change may not be easy, but consolidating 911 systems is the perfect opportunity to both invest in better public safety for cities and better manage tax dollars.

Finance Data on MoSchoolRankings Updated

The Show-Me Institute has added 2021–22 finance data to the MOSchoolRankings.org website. Now users can see two years of detailed financial data for every public school district and public charter school in the state. But let’s take a minute to address a couple of issues and likely questions.

Why did the Show-Me Institute decide to include/exclude “X” category of revenue or spending?

We didn’t. These numbers all come from a report titled the Annual Secretary to the Board Report (ASBR) that each school district and charter school submits to the state. ASBRs are prepared based on guidelines in the Missouri Financial Accounting Manual. ASBRs account for each dollar that comes into a district and each that is spent. Money comes from many sources, including some that may be surprising, such as bookstore sales, food sales to parents, or tuition from other districts. Some sources, such as revenue received from issuing bonds to build a building, are large, one-time infusions of money. We didn’t distinguish between which sources are “important” or “appropriate” for users to consider. We included all money that flowed into each district from every source.

Similarly, we included every expenditure reported in the ASBR. When the site was first launched, many questioned why we included capital expenses, such as land. Again, we included everything reported and provided sufficient detail for users to disregard what they deem to not be true education expenses. Remember, however, that every dollar spent by a public school district is a dollar that wasn’t spent elsewhere for a different public purpose.

Why are the numbers so high?

When every dollar that is spent by public school districts is totaled up and divided by the number of students, the result is often higher than what the public assumes it will be. Survey after survey finds that the public grossly underestimates public education spending. In addition, public education spending-per-student data frequently excludes certain expenditures. Often what is reported is current expenditures or instruction expenditures. The expenditures per student on MOSchoolRankings.org uses the Annual Secretary to the Board Report (ASBR) Total Expenditures as the numerator and the Department of Elementary and Secondary Education (DESE)-reported enrollment for each district as the denominator.

Why don’t the numbers match the expenditures per student on the academic side of the website?

When the Show-Me Institute first launched MOSchoolRankings.org with academic grades for each school and district in the state, we included total expenditures per student for context. These numbers come from a DESE file titled Finance Data and Statistics Summary for All Districts/Charters. We have continued to use this file with each update for consistency. Why those numbers differ from the ASBR totals is not clear.

We hope you find the updated data on the website useful. We are committed to updating the MoSchoolRankings site to give Missourians the best data available on schools in our state.

Teacher Pay: You Can Go with This, or You Can Go with That

The 2001 music video for “Weapon of Choice,” a big beat, electronic song by Fatboy Slim (with Bootsy Collins), featured Christopher Walken dancing through a deserted hotel lobby. The lyrics of the song repeated, “You can blow with this, or you can blow with that.” When I first heard the song, we didn’t have YouTube and I did not have the ability to Google the lyrics. I thought the song was saying, “You can go with this, or you can go with that.” That’s still how I hear the song today.

This is also how I would describe the recent Economics of Education Review paper by Dillon Fuchsman, Josh McGee, and Gema Zamarro.  The authors surveyed more than 5,000 teachers about their stated preferences. The 15-minute survey presented teachers with two hypothetical job offers. Would they prefer a higher salary or smaller class sizes? More pay today or more pay in retirement? In other words, “you can go with this, or you can go with that.”

The paper is a good reminder that our policy choices in education are all about tradeoffs and balancing preferences. Lately, we have often heard that teacher pay in Missouri is relatively low. We don’t hear about the tradeoffs that make it that way. For example, as I’ve written before, Missouri has a very low student-to-teacher ratio—11.3 students per teacher. If Missouri increased this ratio, it could increase teacher pay. As I wrote, “If Missouri were to match Illinois’ ratio of 14.3, Missouri teachers could realize a 26.5% increase in their salaries.”

As it turns out, teachers may prefer to be paid more and have higher class sizes. Fucshman, McGee, and Zamarro find more teachers would prefer to add three students to their class and get a higher salary (78% of respondents) than to have three fewer students and lower pay (65%).

The conversation in Missouri has almost exclusively been “We need to increase teacher pay.” A more robust conversation would consider this and other trade-offs we’ve built into our systems.

An Update on MOSchoolRankings

The Show-Me Institute has added 2021–22 academic data to the MOSchoolRankings.org website. Now, users can see three years of academic data and grades for every public school, district and public charter school in the state. But let’s take a minute to address a couple of issues and likely questions. The math is a bit complicated, but for those who are interested, here are the details on how we calculate expected scores for schools.

What has changed? For the most part, the Department of Elementary and Secondary Education (DESE) data have stayed consistent from year to year. The only difference is in the growth measurement. In the past, DESE changed the growth data to be centered on the number 50, and school (or district) performance was measured as national curve equivalents (NCES) above or below 50, plus an indication as to whether a school’s (or district’s) score was statistically significantly different than the state average of 50. In 2021–22, DESE changed the measurement so that it is centered on 0 and a school’s (or district’s) score is the number of standard deviations above or below 0, plus an indication as to whether the score is statistically significantly different than 0. To the user, however, the most important components are the sign (positive or negative) and the significance indicator (yes or no). These indicate whether the students in a school or district achieved more than average or less than average academic growth in one academic year.

The measures of expected rates in proficiency in English/language arts (ELA) and math are adjusted each year. This is done by taking rates of proficiency in all schools (or districts) for that subject and the percentage of low-income students in each school or district and calculating the relationship between the two using simple linear regression. The resulting intercept (where the resulting line crosses 0) is the rate of proficiency expected in a school with 0% low-income enrollment. The slope of the line indicates how much that expected rate of proficiency declines with each one percent increase in low-income enrollment. These two numbers (the intercept and the slope) were then used to predict rates of proficiency for each school (or district) based on its percentage of low-income students. The expected score is compared to the actual score to see if a school (or district) did better than expected or worse than expected. The slope and intercept are recalculated each year based on that year’s scores.

What hasn’t changed? When this project was launched, using 2018–19 data, we calculated grade intervals for 10 indicators and committed to using the same grade intervals every year. This would allow us to see if schools (or districts) are getting progressively better over time. So, for example, for a school to get an “A” in ELA proficiency, it had to have between 72 percent and 90 percent of its students score proficient or higher. To get an “F,” it had to have 0–18 percent proficient or higher. Even though there has been a global pandemic in the meantime, we have stuck with this commitment. And now we can see how the distribution of grades has changed over time.

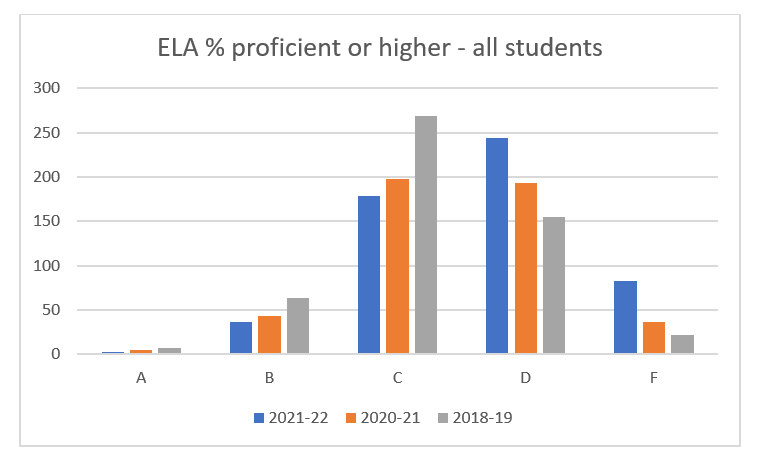
Looking at the rates of proficiency for ELA at the school level (Figure 1), we can see that in 2018–19 grades were distributed in a fairly normal way, with slightly more D’s than B’s. In 2021–22, the number of B’s and C’s declined, while the number of D’s and F’s increased. Unfortunately, that trend continued in 2021–22, with the plurality of schools receiving D’s.

Figure 1

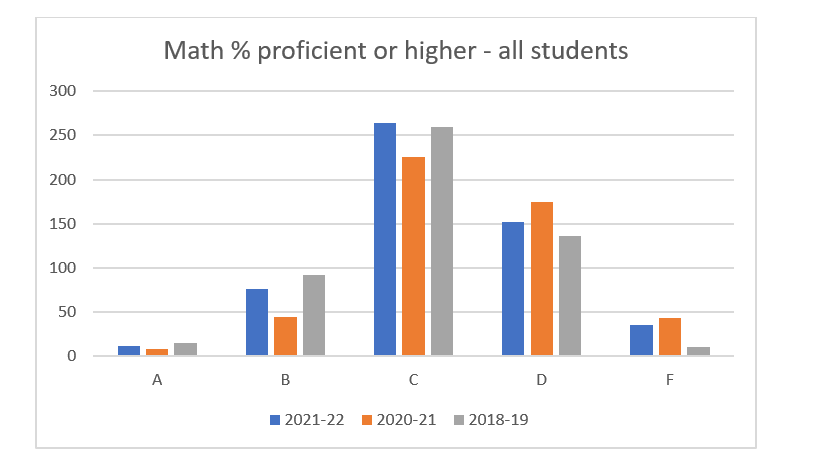
The same is not true for math, however (Figure 2). It appears that schools have recovered somewhat since the pandemic and the grade distribution looks more like it did three years ago.

Figure 2

There is much that can still be learned from the wealth of data that now exists on MOSchoolRankings. org. We welcome any user feedback or questions.

A “Scheme” Worth Looking Into

It’s no secret that Medicaid costs are through the roof. But what if I told you there’s a federal program that’s helping them stay that way? Fortunately, there’s a new effort to shine a light on hospitals abusing the Medicaid financing arrangement to help keep their prices sky high.

For years, I’ve written about Missouri’s reliance on Medicaid “provider taxes” and their role in paying for government-funded health care services. As costs have increased, states have become increasingly reliant on these extra taxes, because they help prop up Medicaid spending by essentially shifting some of the share paid with state tax dollars to the federal government. While this may sound appealing, Missouri’s expected spending on Medicaid has never been higher (nearly $17 billion this year). Provider taxes are a big reason for that, as they make up more than a quarter of all nonfederal Medicaid spending.

As the graphic below shows, provider taxes aren’t like normal taxes, because they essentially allow different health care providers to exploit the way Medicaid is financed and extract additional federal dollars to help keep their Medicaid rates higher. Beneficiaries of these taxes, (i.e. hospitals, nursing homes, pharmacies, and others) claim they’re one of the only taxes where everyone wins. Well, everyone except for federal taxpayers—which of course includes Missouri state taxpayers as well.

Joe Biden, when he was Vice President, called provider taxes a “scam.” Essentially every audit, congressional report, or presidential administration that looks at these things concludes that they should be seriously scaled back or ended for good. And if that ever happens, Missouri is in serious trouble. Our state is one of the most heavily reliant on this financing gimmick in the country.

Now, I wouldn’t hold my breath for any major federal changes to provider taxes because that would require Congress to make a concerted effort at deficit reduction. But the Biden administration’s new effort to look a little more closely at how states are spending these extra federal dollars warrants greater attention. Since 2002, Missouri has allowed the state’s hospitals to essentially manage its provider tax revenues themselves, with little transparency regarding how or where those funds are being spent. It’s possible a little sunlight might help find some opportunities for savings, or at least give Missouri the kick it needs to start weaning itself off this unsustainable funding source.

If health care costs are going to continue their upward trajectory and Medicaid is going to remain the state’s largest budget item, efforts to rein in spending and root out waste will be necessary and should be encouraged. It’s long past time someone gave a closer look at the provider tax “scam.” I just hope Missouri is ready for what the increased scrutiny might expose.

Teachers Need Advancement Opportunities, Not Just Professional Development

According to the Missouri Independent, a “Blue ribbon commission on teacher recruitment” told the “state board of education that educators need professional development opportunities.” That line caught my attention. As someone who has worked in and around the public education sector for nearly twenty years, I think we need to be clear about what we mean here. There is no lack of professional development for educators—what they really need are professional advancement opportunities.

Think of it this way. When someone enters the teaching field after graduating from college, they are called “teacher.” Over the next 30 years, they can get a master’s degree, a specialist degree, or even a doctoral degree. They may attend numerous professional development sessions every year. When they retire, they may still be called “teacher.”

There are no ranks. There are no promotions. There are no steps to career advancement. The only pay raises they will receive will be based on getting additional degrees and each year of experience.

Compare this to higher education. At the higher education level, you may enter as a teaching or research professor not on a tenure track or on a tenure track. Typically, a new professor is called an “assistant” professor. After a few years, the professor can be promoted to “associate” professor and eventually to “full” professor. There are also prized “endowed professor” positions. In short, there are tiers to the profession.

This is not to say higher education is the pinnacle of excellence that should be modeled in every circumstance. Rather, this simply demonstrates the key differences between K-12 teaching and most other fields. In most public school districts, there is no room for advancement within the teaching profession. The only way to advance is to leave the classroom by becoming a principal, superintendent, or something else.

We can imagine a system where teachers are recognized for their performance in the classroom and rewarded in title and in compensation. Teachers need a system that recognizes and rewards excellence—call it merit pay, if you will. They need the opportunity to grow, to excel, and to be rewarded. That is the type of advancement opportunity teachers need. With that said, we should be wary of attempts to create a centralized advancement system from the Department of Elementary and Secondary Education (DESE) or the legislature. The state should empower local communities and local school leaders to develop routes for advancement for their teachers. Centrally imposed systems often become bureaucratic hoops to jump through. Local school leaders may be more motivated to create meaningful advancement opportunities. But this sort of reform surrounding advancement is what we should be focusing on—not red herrings about professional development.

Should More Missouri Students Be Held Back?

Around the country, states are considering implementing policies that would hold back a larger number of 3rd graders who are struggling to read. Currently, 17 states require students who score below a minimum threshold on a standardized test to be retained in 3rd grade, where they will receive focused intervention. In light of Missouri 3rd graders’ recent disheartening Missouri Assessment Program (MAP) scores, should policymakers explore increasing 3rd-grade retention?

Mississippi (which typically holds back between 4–10 percent of third graders) is viewed as a successful model for this type of retention policy. Started in 2013, the Mississippi policy requires a sufficient score on the state English/language arts assessment or on either of the two retest opportunities (with certain exceptions made for English-language learning students and students with disabilities). This strategy is rooted in the idea that students need to receive a firm foundation in reading before advancing to higher grades. Mississippi has seen its efforts pay off—between 2013 and 2019, the state’s 4th-grade reading scores on the National Assessment of Educational Progress (NAEP) rose by 10 points, while the national average decreased by 1. Mississippi moved from rank 49th to 29th in 4th-grade reading over this time period.

There are also drawbacks to this policy. For students who are trying hard and get left behind, this can be a very tough social situation. Having friends go on to the next grade means the student left behind has less interaction with friends—different classes, different sports teams, different lunch schedules, and more. This can be demoralizing for a student. In Mississippi, students can be held back for up to two years before automatically advancing to the next grade. Kids being potentially two years older than their peers can create awkward social situations and increase bullying. You could be driving a car in 8th grade, be an 18-year-old sophomore, or be a 20-year-old senior. One concern is that being 18 as a junior or sophomore may increase drop-out rates. However, Mississippi actually reached an all-time high in its high school graduation rate in 2022—rising from 74.5 percent in 2014 to 88.9 percent.

Can families bear these unconventional social situations in order for their children to succeed in school? Mississippi has seen drastic improvement in both scores and graduation rates since implementing its reading policy. Missouri’s 3rd-grade scores—and frankly all of our state’s test scores— indicate drastic action is needed. Implementing a reading policy such as Mississippi’s may be a good place to start.

Hey! Hey! Hey! Hey! Pay for Your Own Stadium

Yesterday I wrote about an interview I did with KMBC 9 on the Royals’ latest announcement that they had new renderings and “economic impact” details for their new proposed stadium. What makes the subject especially contentious among civic leaders is that the Royals are debating between two sites in the region—one in downtown Kansas City in Jackson County, and one in the inner-ring suburb of North Kansas City in Clay County. The Royals didn’t announce any news on that decision this week, which will likely be made at the end of September when the season ends.

That said, I should make and reiterate a few points about the Royals’ stadium issue, now that it’s back in the news.

There is a bit of deja vu here, of course; about this time in 2022, I was talking about a potential move for the Chiefs, whose lease at the Truman Sports Complex ends when the Royals does. But the takeaway now with the Royals is the same as it was with the Chiefs—sports teams should pay for their playthings themselves. The Royals may be the kings of Kauffman, but when it comes to sovereign action in the real world, public officials should reject spending tax dollars on anything but legitimate responsibilities of government. Subsidizing sports teams isn’t one of those responsibilities.

Show-Me Talks Royals Stadium Move on KMBC

This week, the Kansas City Royals unveiled their latest renderings for two potential new stadia sites—one in Kansas City proper, and one in North Kansas City, which is a different municipality. They also unveiled some new figures for what the team believes will be the “economic impact” of both the construction and operation of the ballpark, wherever it might be. As our readers might have already guessed, the magnitude of that number starts with a “B,” as in billions. The team is essentially promising taxpayers that “all of your wildest dreams will come true.”

I had the opportunity to sit down with Jackson Kurtz at KMBC Channel 9 in Kansas City after the Royals finished their press conference and give him my views on the situation. I’ll have more to say on the Royals tomorrow, but in the meantime, here’s the story we were a part of that ran earlier this week.

Support Us

The work of the Show-Me Institute would not be possible without the generous support of people who are inspired by the vision of liberty and free enterprise. We hope you will join our efforts and become a Show-Me Institute sponsor.

Donate
Man on Horse Charging