The Downtown Council’s Fuzzy Math

On Friday, Kansas City’s Downtown Council hosted its annual luncheon, titled “Downtown K.C. Smart City? Or The Smartest City?” If that makes you think the Council is more interested in boosterism than sound analysis, its “State of Downtown” report won’t make you feel any better. The whole report appears to hinge on creative interpretation and presentation of data.

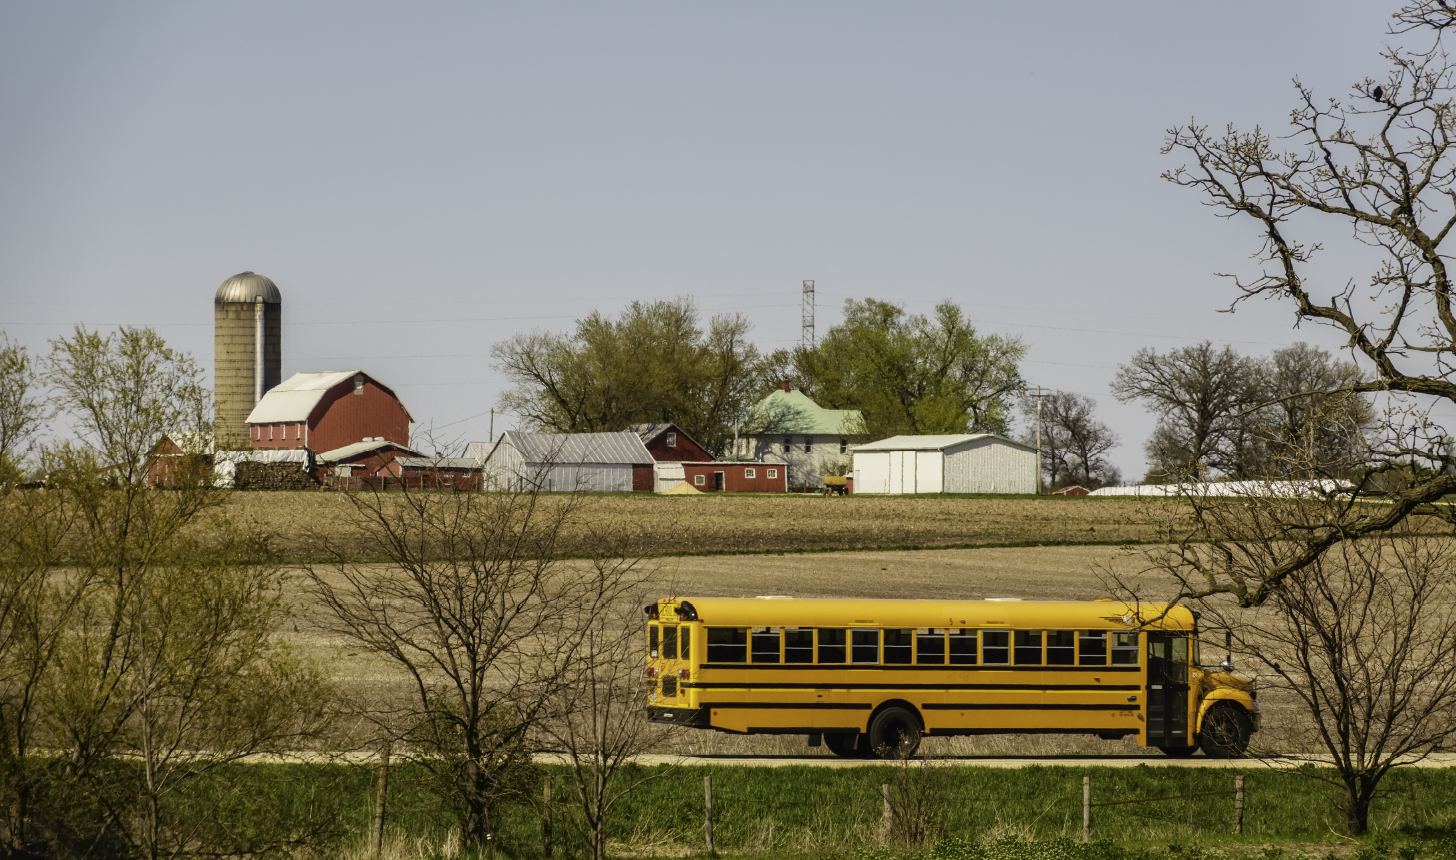
For starters, the report refers to “greater downtown” Kansas City, which extends as far south as 33rd Street and includes the campus of Penn Valley Community College, two miles away from the Sprint Center. That may be a defensible standard, but I’m guessing it doesn’t fit with most Kansas Citians’ understanding. The photo above is of the KC skyline from a point within the area considered “greater downtown.”

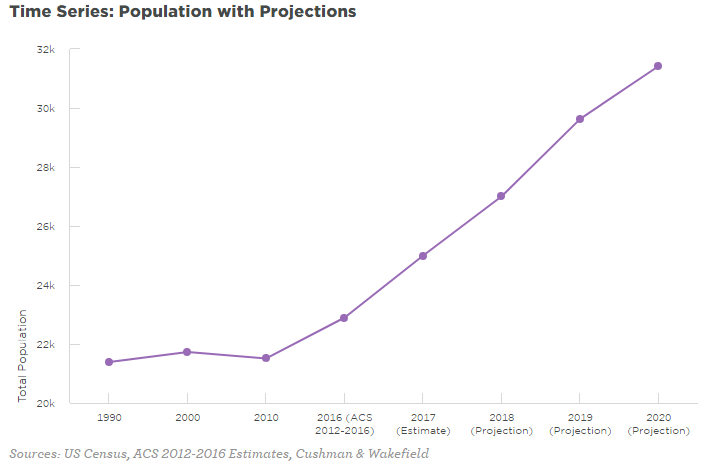
The Downtown Council also released a chart of downtown population growth with projections for future growth, and the outlook is decidedly positive. But if you examine the x axis, you’ll see that 1990 is as far from 2000 as 2019 is from 2020. This scale makes for a misleading presentation of the data.

We took the exact same data points and spaced them more evenly on a time series chart. What you see is largely flat growth from 1990 through 2016. Then the population projection lines rocket upward. The report concedes that this is “unprecedented growth,” but does little to explain exactly why the next few years will be so radically different than the past few decades.

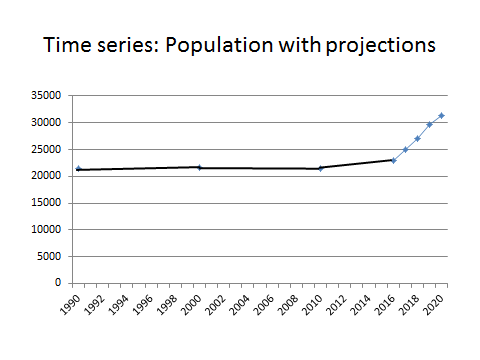
Is it credible that between 2010 and 2020, “greater downtown” Kansas City will see a 46% population growth? For some context, researchers at the University of Virginia project that Kansas and Missouri are only supposed to see a population growth of 4 percent and 3 percent, respectively, in the same time period.

The Downtown Council offers questionable analysis when it discusses which generations choose to live downtown. The text of the report states:

At 41%, Greater Downtown Kansas City has the highest percent of millennials in our community. As you move farther away from downtown, the percentage drops to 26% for Kansas City, MO and 22% for the regional MSA.

The report goes on to tell us:

The data demonstrates that the living, location, and employment patterns of millennials is generally consistent across the country. They are choosing downtown for all their needs.

The report seems to say that because 41 percent of greater downtown residents are millennials that 41percent of millennials live in the greater downtown area. In fact, millennials are not “choosing downtown for all their needs.” Looking at the same 2016 ACS Census data and breaking it down by age group instead of by region, we learn that there are 548,588 millennials (aged 15 to 34) in the Kansas City MO-KS regional MSA. Just over 140,000 live in the city of Kansas City, MO, and according to the Downtown Council, 9,388 live in the “greater downtown.” This means that 74 percent of millennials reside in the region outside Kansas City, MO; 24 percent live inside Kansas City, MO but outside the greater downtown area; and 2 percent live downtown. In other words, downtown may have a large percentage of millennials, but among millennials themselves, only a tiny fraction live downtown.

Everyone wants Kansas City to do well, and promoting a city requires sound policy that rests on solid research. The “State of Downtown” report seems to provide neither. In fact, by presenting population projections wildly at odds with both recent history and state trends, and by overlooking where millennials chose to live, this report appears to deliver little more than mere boosterism.

Tax Reform and Tax Hypocrisy

Conservatives have long argued that taxes matter. Sure, they matter, progressives have countered – if all you care about is making the rich richer and doing nothing to help working people.

Witness an incredible turn of events:

We now hear the proudly progressive governors of California and New York howling in outrage at the removal of a substantial tax break for those at the highest level of income – the top 10 percent, and, especially, the top one percent.

Under the Tax Cut and Jobs Act that went into effect on Jan. 1, taxpayers may no longer count all of their state and local income tax payments, plus property taxes, as deductible expenses on their federal returns. The new law caps the deductibility of these state and local taxes (the so-called SALT deduction) at $10,000 per taxpayer. What follows is a rough calculation of how the cap will impact people at several different levels of income (focusing only on California, where local income taxes are not as important a factor as they are in New York, and disregarding property taxes).

Based on California income tax tables, a couple earning $150,000 in 2018 will owe $8,797 to the state of California – with the consolation of knowing that every cent will be deductible. The couple will save about $2,000 on their federal return.

A tipping point occurs at $164,000 in adjusted gross income. Exceeding that, a California couple filing jointly runs out of cap room and gets no further benefit from the SALT deduction.

The top one percent in California starts at about $500,000, according to the latest available data from the Internal Revenue Service. With that income, an entry-level couple in the one percent club will owe $41,347 to the state. Since all but $10,000 of the state tax is nondeductible under the new law, it has the effect of bumping up the adjusted gross income on their federal return by $31,347. Applying the top federal rate of 37 percent to that sum, the couple will owe an additional $11,598 to Uncle Sam.

The average income for families in the top one percent in California is $1.6 million, or more than three times the starting income. So how does the “average” ultra-rich family fare under the new tax regime? In 2018 it will owe $165,072 to the state – with a whopping $155,072 no longer counting as a deductible expense. Consequently, the family will take a hit of a little more than $57,000 in what it owes to Uncle Sam.

In a nutshell, the top one percent of filers in California are about to lose a huge tax break. No longer will they be able to reap one dollar in federal tax savings for every three or four dollars going to the state government.

No wonder the governors of the two states are worried. At 13.3 percent, California has the highest marginal income tax rate of all the states. New York State’s top rate is 8.82 percent, and that jumps to 12.7 percent in New York City. Each state garners nearly 50 percent of its total income tax revenues from the top one percent of earners.

Who has compensated for the outsized deductions that the highly paid denizens of Hollywood, Silicon Valley, and Wall Street have been able to claim on their federal returns due to exceptionally high state and local taxes?

Taxpayers in low-tax states and less affluent regions have done so. In the process, they have helped to subsidize the growth in public spending that has occurred in Sacramento, Albany, and New York City.

The situation will soon change. In early 2019, when people file their local, state, and federal tax returns for the 2018 tax year, the cross-subsidies, of a reverse Robin Hood nature, will largely disappear.

At the same time, taxpayers outside the top ten percent of filers will appreciate the positive impact of a near doubling in the standard deduction – to $12,000 for individuals and to $24,000 for couples. According to the nonpartisan Tax Foundation in Washington, D.C., a married couple with two children and a combined adjusted income of $85,000 will reap a $2,254 tax savings in 2018 as a result of provisions in the new law.

So, what about the vociferous complaints coming from progressives, who say that the new law only serves to make the rich richer and does nothing to help working people?

But the tax tables tell an entirely different story.

Workforce Development Must Encompass the Spectrum of Professions

The state cuts to higher education proposed by the governor this month have generated a lot of discussion about how they might affect four-year degree programs in the state and, eventually, the state’s future prosperity. As I’ve written before, a good education can often lead to personal financial security, and certainly funding reductions to four-year programs may affect whether some students enroll in those programs. 

But if the conversation about workforce development ends there, then it will have covered only the “seen” impact of public policy. Instead, policymakers should also consider the unseen consequences of oversubsidizing fields offered through our higher education system and neglecting other possible workforce investments. As the cargo-cultification of STEM (science, technology, engineering, and math) jobs has escalated in public policy circles in recent years, workforce development policy has increasingly emphasized professions requiring at least a bachelor’s degree, while other quality jobs that don’t require that version of education have been neglected—or even denigrated

Mike Rowe of Dirty Jobs fame, who’s become a fierce public proponent of jobs of all stripes, may have put it best in this response to a detractor last year:

To be clear—I strongly support education in all its forms. I have a college degree, and as I’ve said many times, it’s served me well. But I believe society is making a terrible mistake by promoting college at the expense of all other forms of education. For instance, the surgeon you reference (who I would indeed prefer to have graduated from an accredited university) will never make it to the hospital to successfully remove my appendix without a functional infrastructure, which depends almost entirely upon an army of skilled tradespeople. And yet, our society clearly values the surgeon far more than mechanic who keeps her car running, or the contractor who put in the roads that allows her to drive to the emergency room.

We need people with formal higher educations. We also need people in professions that don’t require such degrees. The perception—often promoted by four-year institutions seeking tax dollars—that high paying jobs require degrees is plainly wrong.

It certainly remains true that four-year degree holders tend to make more than those who don’t hold such a degree, but while the average salary might be higher, there is a lot of variance in those numbers when you get down to the individual level. I have countless friends in their early 30s with undergraduate and graduate degrees who are scraping by under the twin pressures of loan payments and compressed salaries in both STEM and non-STEM professions. At the same time, I also know countless blue-collar professionals in their early 20s who have been catapulted into life’s comforts with a rising middle class salary thanks to professions like construction that, especially now, have tons of jobs but hardly enough trained professionals to fill them. (We’ve talked about this issue before.

Policymakers who believe in limited government need to reassess what the state spends its money on—what the state subsidizes directly and indirectly—and this is as true in the realm of workforce development as it is in other parts of the budget. Surely, STEM industries and other higher education programs deserve attention, but policymakers should exercise considerable caution in treating those jobs as talismanic rather than as components in a much larger, and much more diverse, state jobs portfolio.

Yes, the Cost of Medicaid Has Exploded

This week the St. Louis Post-Dispatch penned an article about whether the cost of Missouri’s Medicaid program has “exploded.” The paper dismissed the idea, quoting a constellation of liberal organizations to explain away a pretty staid assertion made by Governor Eric Greitens.

“Despite the fact that Missouri’s economy is growing and we’re in a stronger position than we were last year, what continues to be the greatest challenge in the budget is the explosion in federally mandated and other health care spending,” Greitens said Monday at a news conference in Jefferson City to outline his budget plan.

From there, the paper embarks on a roughly 1500-word odyssey to impress on readers that four- or six-percent rates of growth in the Medicaid program do not a cost “explosion” make. This pronouncement, delivered without providing any context, fails on several fronts, including the fact that both figures are double and triple the rate of inflation, respectively.

But I wouldn’t constrain the question of whether Medicaid costs have exploded to a single year, anyway. Consider the program’s growing impact on Missouri’s budget. According to the National Association of State Budget Officers (NASBO,) Missouri spent 18.4 percent of its FY2000 budget on the Medicaid program. By FY2016, that figure had more than doubled to over 37 percent of the state’s budget. As we’ve argued for years, Medicaid’s cost problems aren’t some artifact of Obamacare alone. The program has long been broken and, like the rest of the health care system, outpaced inflation—eating into public spending priorities just as private health care has grown in our own budgets. Over the last 17 years, Missouri even lowered eligibility thresholds for certain populations, and yet overall costs have continued to rise.

Years of cost increases—even if only of the four- or six-percent variety—add up to an ongoing cost explosion. That is precisely why former President Barack Obama said this back when he was selling Obamacare. (Emphasis mine)

And, finally, the explosion in health care costs has put our federal budget on a disastrous path. This is largely due to what we’re spending on Medicare and Medicaidentitlement programs whose costs are expected to continue climbing in the years ahead as baby boomers grow older and come to rely more and more on our health care system. That’s why I’ve said repeatedly that getting health care costs under control is essential to reducing budget deficits, restoring fiscal discipline, and putting our economy on a path towards sustainable growth and shared prosperity.

So yes, Medicaid’s costs are exploding. And the sooner we can get to reforming the program, the better.

The Financial State of Missouri Cities

It won’t be a surprise to readers of this blog that Kansas City and St. Louis are in bad financial shape. Taxes and debt are both high. But a recent study of American cities finds that things may be even worse than we thought.

The reason for the discrepancy is that according to the report, “cities balance budgets using accounting tricks” such as moving payments to a different year or failing to make sufficient payments to public pension funds. None of these solve the problems, of course; they just shift the burden to future taxpayers.

The organization Truth in Accounting, a nonprofit dedicated to honest accounting in municipal finances, “developed a sophisticated model to analyze all the assets and liabilities of the nation’s 75 most populous cities, including unreported liabilities.” Kansas City and St. Louis are ranked 55th and 66th (lower on the list means higher unreported liabilities), respectively. How did this happen?

While both Kansas City and St. Louis have balanced budget requirements, both have accumulated a great deal of debt. The report points out that cities can do this by inflating revenue assumptions, understating the true cost of government, and delaying the payment of bills.

The report also states that most of the top U.S. cities do not have enough money to pay their bills. In the aggregate, these cities have $335 billion in unfunded debt. That includes $211 billion in pension debt, largely the result of cities papering over their cash problems by shortchanging their public pension obligations:

Although these retirement benefits will not be paid until the employees retire, they still represent current compensation costs because they were earned and incurred throughout the employees’ tenure. Furthermore, that money needs to be put into the pension fund in order to accumulate investment earnings. If cities didn’t offer pensions and other benefits, they would have to compensate their employees with higher salaries from which they would fund their own retirement.

Missouri is no stranger to these problems. The problems at the state level are well publicized, but there are also serious issues at the municipal level.

These are just some of the highlights; the entire list of factors contributing to the financial woes of St. Louis and Kansas City is too long to cover in a blog post. As we enter the new year with a list of new projects and priorities, perhaps policymakers should spend less time fixating on pie-in-the-sky solutions, like luring Amazon to the state. Instead, they should  focus on the less glamorous but more important task of regaining sound fiscal footing. 

Governor Releases Tax Plan, Rightly Aiming For Revenue Neutrality

 After releasing his proposed budget last week, today Governor Eric Greitens followed it up in with his long-awaited tax cut plan. Readers will find details at the link, but I wanted to highlight one noteworthy paragraph from the release:

In order to responsibly achieve these results, Missouri should eliminate or alter some tax breaks that are outdated, unfair, or unnecessary, and close loopholes in the tax code. This tax plan boldly cuts taxes for nearly every Missouri taxpayer and dramatically improves Missouri’s tax environment for businesses. It is also revenue-neutral according to an analysis from the Department of Revenue. By eliminating these breaks and closing these loopholes, Missouri families and businesses will see a tax cut and Missouri’s budget will not be unduly burdened. The alterations to tax breaks and loopholes are laid out in detail in this document.

Translation? Rather than continuing a raft of carve-outs for special interests and activities—carve-outs whose burdens, of course, fall on the shoulders of other taxpayers—this plan appears to be a reorientation of tax policy away from income taxes and toward a broad sales tax base. The immediate beneficiaries should be individuals (especially the poor, whose income taxes would effectively be zeroed out under the plan) and corporations, whose income tax rate would be cut by about a third. 

I could write at length comparing this  plan to the two tax cut plans already afoot in the state Senate. Perhaps the biggest difference is that this plan appears to omit an increase in the gas tax for infrastructure improvements. But it seems in all three cases, the policy principle sitting in the sidecar of each tax cut plan is that of revenue neutrality. As I discussed with Marc Cox earlier this month, while the details of the Governor’s plan were unknown at that time, it was reasonably easy to speculate about its principal parts, given the explicit neutrality targets and what had already been filed in the Legislature.

That isn’t to say that tax cuts must always be revenue-neutral, since reorganizing tax revenues for a government that has grown too large obviously doesn’t address its largeness. Yet, one can divide the questions of pro-growth tax policy and government size into different legislative pieces rather than addressing both issues all at one time and, potentially, confusing the issues in the process. These proposals address the pro-growth policy questions first and leave the question of government size for a later date, and in my opinion, that’s a responsible approach that adheres to both good and limited government principles. 

Support Us

The work of the Show-Me Institute would not be possible without the generous support of people who are inspired by the vision of liberty and free enterprise. We hope you will join our efforts and become a Show-Me Institute sponsor.

Donate
Man on Horse Charging