Earlier today I wrote about how government-backed insurance cooperatives around the country have begun to fail. The reason? Dollars and cents. The cooperative plans were not financially sustainable, and since they could neither substantively raise prices nor get the government bailout they expected, these plans—predictably—folded.
Missouri doesn’t have a “cooperative” plan, but it does have what amounts to for-profit equivalents experiencing adverse selection problems nearly identical to those of the co-ops. How are these Missouri insurance plans dealing with these financial problems? Rate hikes, of course.
New data for the 37 states that use the federal HealthCare.gov marketplace, rather than run their own exchanges, suggest that premiums for next year will be going up far more in the Kansas City area than in many other large cities.
The monthly premium for the benchmark silver plan will increase by an average of 6.3 percent for the 30 cities included in the new data from the Department of Health and Human Services. But in the Kansas City area, premiums for that plan will jump by 20.1 percent next year.
. . . Rates appear to have escalated in Kansas City because Coventry, which had the second-lowest-priced silver plan this year, raised its rates for 2016 by an average of more than 25 percent, said Ron Rowe, vice president for sales of Blue Cross and Blue Shield of Kansas City.
Simply telling people they have coverage is not the answer to America’s health care policy problems—a fact the ever-growing list of failed and failing Obamacare insurance plans bears out. Until we get a handle on the cost of health care as a country, it will be very difficult to substantively guarantee access to care to the people who need it most, whether in the private market or in a welfare program like Medicaid. We can, and must, do better.
Leaders in Saint Louis have touted the city for its efforts to attract new businesses, especially high-tech startups. Square’s decision to locate in the city has been held up as evidence that the city’s tech incubator (T-Rex) and its innovation district (Cortex) are having the desired effect. Speaking about the new Square office, Mayor Francis Slay said:
We have made a conscious decision as a community to build the infrastructure to retain, attract and grow tech companies here and support entrepreneurship. It’s one of our strongest economic drivers.
While few would dispute that many great tech companies are starting in, and coming to, Saint Louis, the data show that in terms of companies and jobs, Saint Louis is losing as many as it is gaining.
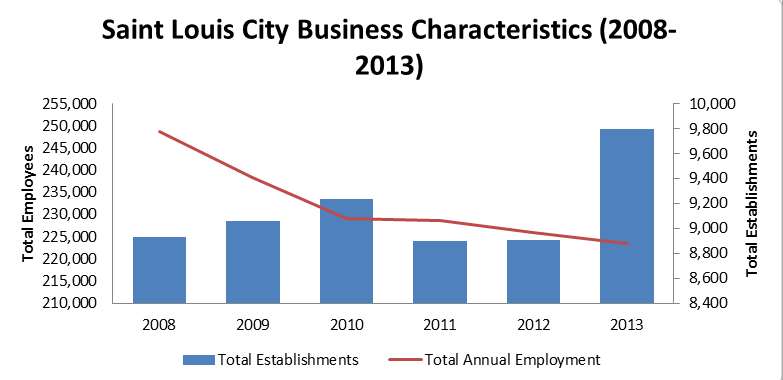
To see this, we can look at Census Data that tracks Saint Louis City business establishments from 2008 to 2013 (which excludes government employees and self-employed persons). The period starts just before the recession and ends three years into the “recovery.” Over that time, Saint Louis City’s total business establishments rose by 866, or about 10%. That may sound good, but the problem is that over the same period the city’s total paid employees decreased by more than 25,000 (as shown in the chart above).
The increase in business establishments and decrease in employment seem counterintuitive until one notes that all the city’s net establishment gain came from the smallest businesses (from one to four employees). Total businesses with more than four employees decreased in the city over the period examined.
Contrary to the popular narrative, growth in small companies did not come primarily from tech fields. Instead, the main growth sectors were health services and education (meds and eds):
Sector
Business Growth (2008–2013)
Employment Growth
Healthcare
1,399
1,653
Education
20
2,471
Information/Professional, Scientific, and Technical Services
–10
–2,883
All Other
–543
–26,492
The Saint Louis economy has performed better in 2015 than in previous years, so it is possible that future data will show greater business and employment growth. However, the latest census data strongly suggest that:
1. In recent years city has failed to retain or increase medium- and large-sized businesses of nearly every type.
2. The business and job growth there has been is mostly attributable to health services and education, not tech startups.
We all want fewer high school dropouts. James Shuls, Ph.D., notes that research has confirmed that school choice reduces the dropout rate. A student who has school choice options is more likely to graduate than a student whose only educational option is the public school system.
Most people don’t know this, but the Netherlands has had a universal school voucher system since 1917.
I know what you’re thinking: “Wait a second, all of these people tell me that if we have school vouchers, they will drive wedges in our communities and lead to intolerance and social turmoil. From what I know from my kids’ trips to Amsterdam, the Netherlands is a . . . tolerant place.”
Even though school vouchers were initially proposed in the Netherlands so that different religious communities could essentially segregate themselves in response to centuries of strife between Catholics and Protestants, over time they have been part of a country that is growing less sectarian. While I have no direct proof, I would wager that decreasing the number of fights over what gets taught in school has helped folks get along better.
But in addition to facilitating social cohesion, the voucher system in the Netherlands has helped create a really solid education system. On the 2012 international PISA exam, the Netherlands ranked 4th in the world in math, 8th in science, and 10th in reading. It isn’t necessarily fair to compare the Netherlands with a country that is 20 times larger and substantially more diverse, but for reference, the United States ranked 27th, 20th, and 17th on those tests, respectively.
Specifically, access to private schooling has helped Dutch students. A 2013 study in Education Economics used some nifty statistical footwork (an instrumental variables analysis to account for the selection bias that would otherwise make comparisons between private school and non–private school students inappropriate) to reveal strong positive effects for students using the voucher program to attend private schools. The effects were anywhere between 0.2 and 0.3 standard deviations, which would move a student at the mean of the standard bell curve of student performance up 10 or so percentile points (from a 50 to a 60).
Given these large effects, it shouldn’t be surprising that in a system where two thirds of the schools are private, we see strong academic performance. What’s more, according to the National Center on Education Statistics, Dutch schools spend on average $1,500 less per student per year than American schools do.
The Netherlands is more than canals and bicycles. It is a multi-ethnic and pluralistic society with an education system with parental choice at its heart. While it would be impossible (and even if possible, unwise) to try and import the Dutch education system to America, it does shed light on key concerns that Americans have with a system driven by school choice. Far from underperformance and balkanization, we see tolerance and success—two things we can always use more of around these parts.
After significant delay, Missouri and Saint Louis City residents finally have a proposal on how much the public will be expected to pay for a new football stadium. And while it looks as if the city won’t be paying more in upfront costs for a stadium than they are now, the fine print shows this may be a worse deal than the notorious lease the city used to get the Rams in the first place.
Before diving into the numbers, it is important to note once again that the proposal before city leadership is not the end result of a negotiation with the Rams or Stan Kroenke. The Rams organization has remained completely silent on what, if anything, the city can do to keep the team in Saint Louis. The NFL, which could possibly block a move, has also failed to make firm commitments to the city. With the caveat that nothing is final, if the stadium funding plan goes through the city will likely be financially worse off than it is now, for the following reasons:
1. It will cost the city more than last time. In building the Dome, the city agreed to make $6 million a year in bond payments for 30 years. For the new stadium, Saint Louis will add remaining Dome debt to new stadium debt, to make payments that start at $4.5 million and escalate to $9 million over the course of 36 years. That does not include the millions that city residents have paid already through sub-municipal governmental bodies.
2. It has hidden, unaccounted-for costs. Stadiums cost millions of dollars every year to maintain and operate, little or none of which is covered by NFL teams. The current plan does not account for these costs, aside from proposing adding new taxing districts. But if the future stadium costs and Ram’s tax revenue is anything like it is now, those districts will be wholly unable to cover costs. And speaking of revenue…
3. It means less tax revenue than before. The city plans to give the vast majority of taxes (sales and otherwise) collected at the new stadium, which the city would normally collect, back to the Rams. Saint Louis City only collects about $4.2 million in total from the Rams right now, and this plan would likely mean the city gets even less in the future.
4. It diverts needed money from the Dome. For the Edward Jones Dome to operate into the future, it reportedly needs about $100 million in capital improvements and continued maintenance. The revenue stream that currently funds the Dome would be diverted to pay for a new stadium, with nothing to take its place.
The bottom line for the city is that with this deal, to which the Rams have not agreed, the city is likely to pay more and earn less than it has for the last 20 years. Worse yet, maintenance for the new stadium and on the Dome are not accounted for, virtually guaranteeing that someone (not the Rams) will need to pay more later on. Is football so important to Saint Louis residents that they would mortgage their city’s future to give millions of dollars to an uninterested billionaire?
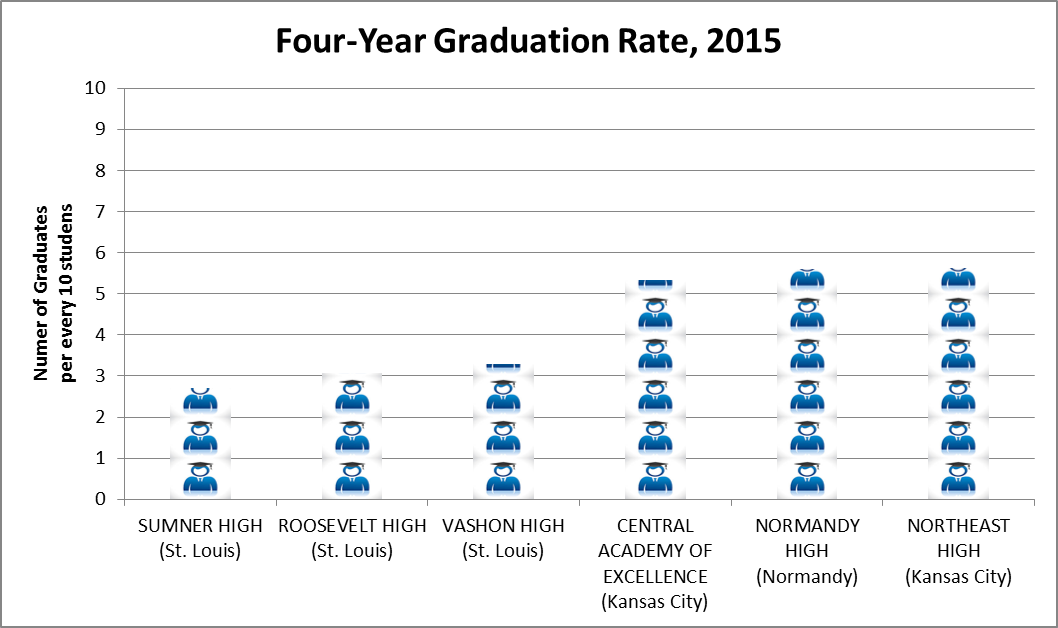
Fewer than three out of ten students who enter Saint Louis' Sumner High School in ninth grade will graduate from the school within four years. In all, there are six high schools in Missouri where fewer than 60 percent of students graduate on time. Fortunately, students in the Kansas City and Saint Louis School Districts have magnet schools and charter schools as an option. In Normandy, students have no such options. They are stuck. Keep this in mind as you read this post.
Recently, the Center for Public Education, an arm of the National School Boards Association, released a report on the merits of school choice. The paper claims to summarize “what the research says.” Interestingly, the report fails to include almost every analysis that has found benefits to private school choice programs.
When Anna Egalite, an assistant professor of educational leadership, policy, and human development at North Carolina State University, conducted a systematic review of the competitive effects of private school choice programs, she found 21 studies. She concluded that the results “unanimously find positive impacts on student achievement. Such overwhelming evidence supports the development of market-based schooling policies as a means to increase student achievement in traditional public schools.” Interestingly, the Center for Public Education did not cite any of these studies.
Similarly, there have been 12 random-assignment studies of voucher programs. These are considered the “gold-standard” in social science research because they are the best at determining causality. Eleven of the 12 studies have found positive effects from voucher programs. The Center for Public Education review only cites one of these studies.
The report cites plenty of useful statistics from the National Center for Education Statistics and other sources, but does not even attempt to cite the plethora of useful research on school choice programs.
Nevertheless, the report does get at least one thing right—private school choice tends to boost graduation rates. This was highlighted in the evaluation of the Washington D.C. Opportunity Scholarship program, which showed a 21 percentage point increase in the graduation rate for voucher users.
Not surprisingly, given that they neglect to cite any of the ample evidence showing that school choice succeeds, the Center's conclusion is that “In general, we find that school choices work for some students sometimes, are worse for some students sometimes, and are usually no better or worse than traditional public schools.”
In addition to simply being inaccurate, this conclusion does a great disservice to the students most in need of another educational option; particularly the students in the six Missouri school districts with the worst graduation rates (see above).
School choice may not be a cure-all, but the evidence is quite clear: students benefit from school choice. Indeed, students at Sumner and the other schools listed above may benefit the most.
Everyone at the Show-Me Institute, especially those in the Kansas City office, offer our ecstatic if hoarse congratulations to the Royals for their World Series championship. More than merely winning, the team demonstrated how the game ought to be played.
It's been said time and again that the Kansas City Royals have succeeded by playing small ball; focusing on base hits, keeping the runs coming. There is no dependence on big personalities, and hopes aren't pinned to a dramatic swing for the fences to win the game. The Royals charted their own course, built on their own strengths, and delivered a product no one else could.
Kansas City government—and Missouri government in general—could learn a lot from that. Instead, city leaders engage in the municipal me-tooism of convention hotels, streetcars and airports. We pin our hopes on big plays (Boeing tax credits, Power & Light District) and neglect the basics (deferred maintenance on neglected infrastructure, diverting funds from schools, libraries, sewers, public safety). As a result, the City of Fountains cannot afford to maintain its fountains.
Policy makers are sacrificing the basics in order to score with big projects. It isn't working. We ought to learn the lesson of the Royals' last two seasons: focus on the basics, play to your strengths, keep the line moving.
On October 15, members of the Kansas City City Council heard from developers and supporters of a proposal to use taxpayer funds to subsidize a $300+ million convention hotel. The Show-Me Institute’s Patrick Tuohey suggested that Council members need to read the reports prepared by consultant to the developers and others to assess the wisdom of investing taxpayer dollars. From what we’ve seen so far, we question whether the projections made are realistic—especially when similar projects in Kansas City have failed in the past.
Today voters in the Mehlville School District will decide if their current property tax rate will increase by 49 cents per $100 dollars of assessed valuation. If Prop R passes, the owner of a $150,000 dollar home will pay about $140 more per year in property taxes.
Funds raised from the tax increase will be directed toward priorities such as hiring 16 new certified teachers to help struggling students and restoring technology and student club funding. Proponents of Proposition R say that without additional funds, home values will decrease due to declining academic performance. Opponents believe the additional funds won’t be used wisely, in which case the increased tax rate will lower the value of their homes.
Analysts at the Show-Me Institute have looked at how school quality and tax rates affect home prices. In Real Estate Assessment and Property Taxation, analysts demonstrated that the quality of schools and their related tax rates are capitalized into the value of property. As the video below explains, homeowners in the Clayton and Ladue school districts in Richmond Heights pay substantially more for comparable homes with better performing schools and lower tax rates.
In short, homeowners and voters want to get the most bang for their tax bucks. The following data on school performance and school funding may shed some light on what’s going on in the district.
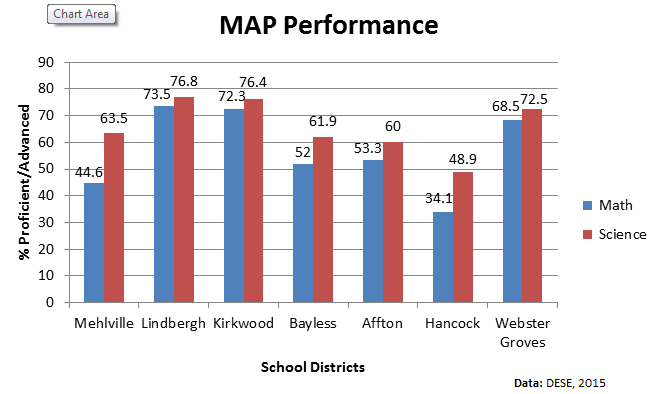
First, the graph below shows how Mehlville and the districts around it performed on the MAP test in 2015 in both math and science.
Mehlville doesn’t look great. In fact, the district has the second lowest math scores in the area.
But, if we look at a second data set—college readiness indicators like average ACT scores, college remediation rates (the percentage of students who enroll in courses they should have completed in high school), and the number of AP courses the district is offering—Melville is performing better than other districts in the area (see table below).
College Readiness Indicators
School District
Avg. ACT Score
College Remediation Rate
# of AP Courses Offered
Mehlville
23
32.9
16
Kirkwood
24
30.3
19
Lindbergh
23
23.6
19
Bayless
21.7
59.6
2
Hancock
22
33.3
9
Affton
19.7
50
5
Webster Groves
23.1
24.6
3
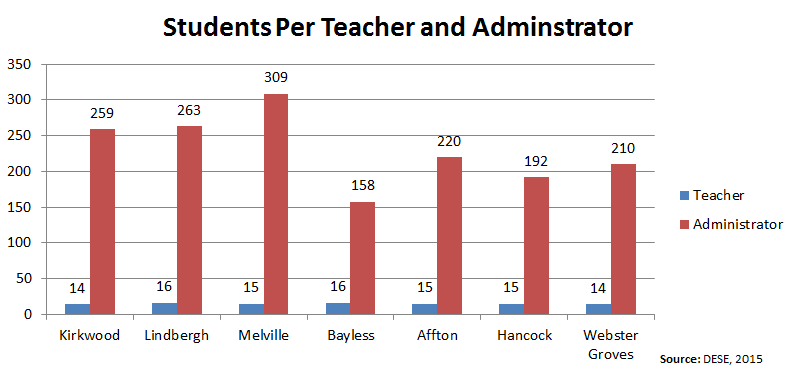
Even with reports of losing teachers to neighboring districts, Mehlville is able to offer a large number of AP courses and prepare students for college at about the same rate as neighboring districts with more teachers and administrators (as our next graph displays).
The graph below presents teacher/student and administrator/student ratios. Mehlville has more students per teacher than Kirkwood, but fewer students per teacher than Lindbergh, even though both are better-performing districts. Mehlville also has the highest student-to-administrator ratio in the area.
Finally, relative to other school district property tax rates in the area, Melville has the lowest rate:
School District
Tax Rate Per $100
Mehlville
$3.7621
Kirkwood
$4.2524
Lindbergh
$4.2906
Bayless
$4.7682
Hancock
$4.8164
Affton
$5.368
Webster Groves
$5.8584
So what should we make of all of this? Frankly, it’s tough to say. In some ways, it appears that Mehlville is operating efficiently. With fewer teachers and administrators and a lower tax burden, the district is achieving about as well on several key indicators as other districts. In other ways, it appears that the district is lagging behind.
The real question is whether new dollars will do anything to move the needle on student performance. Simply hiring more teachers and investing in technology and student clubs doesn’t seem particularly compelling. What’s more, will raising taxes hurt Mehlville’s competitive edge in recruiting new homeowners? Without strong answers to these questions, it is hard to determine if taxpayers should get behind any effort to increase tax rates in the district.
Support Us
The work of the Show-Me Institute would not be possible without the generous support of people who are inspired by the vision of liberty and free enterprise. We hope you will join our efforts and become a Show-Me Institute sponsor.