KCATA Makes Changes to Improve Bus Service

Kansas City's Northeast News reported on Tuesday that the Kansas City Area Transit Authority (KCATA) will be combining several bus stops in the region to "improve passenger satisfaction."

On Oct. 4, 2015, six routes will be affected, including 24-Independence and 30-Northeast. Stops being removed will have Rider Alerts posted at each location. In a press release from the KCATA, the biggest factor in removing a stop is low ridership at a specific location, which will provide a smoother ride and help keep buses on time.

This is good news: a sign that the KCATA is reviewing their ridership information and making changes where necessary. But they can do more than just make changes to where buses stop, as this latest plan does. In the past, KCATA has issued bulletins about changes in service. Some are temporary responses to construction or large events, and some are more permanent changes in routes. As populations shift, KCATA is able to assess need and make changes to routes, route frequencies, and the number and location of stops. This is a good thing, and underscores the exact reason why modern bus transit is superior to light rail and streetcars. Not only can fixed rail not be rerouted to account for changing population needs, the train cars themselves cannot even change lanes to avoid broken down vehicles or other train cars.

As has been said before, trains don't take you were you want to go, they take you where developers and urban planners want you to go. KCATA's recent actions demonstrate exactly why buses are a better transit choice.

Naming and Shaming Corporate Welfare Queens

A mayor in Maine has made the news for wanting to publicly list welfare recipients on the town's website.

I don't share his policy view on this matter, but I would like to see the same "naming and shaming" program applied to corporations who accept public subsidies from municipal government. And I am not alone. My colleague Patrick Ishmael recently wrote about new standards from the Government Accounting Standards Board (GASB), In short, the new standards increase the amount of information that local governments have to publicly report about the number and type of tax abatements.

One shortcoming of the new standards is that they do not require localities to list the various subsidies by company. This would be an additional measure of government transparency that localities could adopt on their own through city ordinances. It would tell us which companies are the welfare queens of crony capitalism.

The Latest with Licensing Landlords

The saga of landlord licensing continues in Saint Louis County. With government finding more and more things to regulate, landlords might find themselves the next victims of government’s “do something” mentality.

Last week, I wrote about how Saint Louis County was considering a bill that would require landlords in unincorporated parts of the county to apply for licenses in order to rent out property. Proponents of the measure claimed that this bill will only affect those landlords who don’t keep their property up to standards. However, due to push-back on the bill, the sponsor has made amendments to make it more palatable. Yet these changes do little to actually improve the situation for landlords in the county.

The main problem with this bill is that it still makes landlords responsible for the actions of their tenants. If a renter received a felony conviction for one of a long list of offenses (selling drugs, gambling, and prostitution are included), and if even one of these incidents happened on the rental property, the landlord would be obligated to evict the tenant. If the landlord failed to do so, his or her license would be revoked.

Such a provision harms both landlords and their tenants. It harms landlords because it denies them flexibility in dealing with tenants. For example, what if a tenant is convicted of dealing drugs, but his wife was not guilty of any felony? Is the landlord supposed to evict the entire family because of the actions of one person? The law is unclear, but it seems to me that as long as the rest of the tenants keep up their end of the lease agreement, the landlord should have the option of letting them stay.

This bill would also harm some renters because this provision encourages landlords to discriminate based on the possibility of some future illegal activity. Why enact a law that gives cover to this sort of discrimination? It doesn’t make sense.

Putting aside this provision, the fact that landlords need to jump through yet another bureaucratic hoop in order to lease property makes it less likely that landlords will enter the market, thus hurting consumer choice. Nobody wants substandard housing, but licensing landlords is not the way to address this problem in Saint Louis County.

Default Rates among Missouri Colleges and Universities

The table below (data from the U.S. Department of Education) displays default rates for Missouri colleges and universities over a three-year period. The default rate for 2012 is calculated by dividing the number of students who had defaulted as of December 2014 by the 2012 cohort total. The difference over the three-year period is displayed in the fourth column. Across the state, many default rates have decreased since 2010. The highest default rates occur among public 2-year community colleges. The highest default rate in the state is Three Rivers Community College at 28.2 percent.

Default Rates in Missouri (percentages)

Public 4-Year

Default Rate 2012

2011

2010

Difference

University of Missouri

4.2

5.5

6.1

-1.9

University of Missouri–Kansas City

7.2

9.7

9.7

-2.5

Missouri University of Science and Technology

3.1

3.8

5.3

-2.2

University of Missouri–St. Louis

7.6

8.6

10.3

-2.7

Harris-Stowe State University

25.6

29.6

27.9

-2.3

Lincoln University

20.7

25.4

27.2

-6.5

Missouri Southern State University

11.6

15.8

14.1

-2.5

Missouri State University

7.3

7.9

8.5

-1.2

Missouri Western State University

15.7

16.5

22.0

-6.3

Northwest Missouri State University

7.8

9.5

9.7

-1.9

Southeast Missouri State University

10.1

11.6

13.3

-3.2

Truman State University

3.9

3.8

3.7

0.2

University of Central Missouri

8.8

10.1

9.2

-0.4


Private 4-Year

Default Rate 2012

2011

2010

Difference

Avila University

6.8

7.9

9.6

-2.8

Central Methodist University

8.4

10.6

12.3

-3.9

Columbia College

14.3

13.3

11.6

2.7

Culver-Stockton College

8.1

10.0

13.2

-5.1

Drury University

15.2

17.1

16.7

-1.5

Evangel University

6.4

7.0

6.9

-0.5

Fontbonne University

6.1

8.1

11.2

-5.1

Hannibal-LaGrange University

7.9

8.0

6.5

1.4

Lindenwood University

3.4

4.0

4.9

-1.5

Maryville University

5.5

6.0

5.6

-0.1

Missouri Baptist University

5.9

7.8

8.6

-2.7

Missouri Valley College

15.6

10.0

15.2

0.4

Park University

7.9

9.8

11.5

-3.6

Rockhurst University

3.6

5.7

5.6

-2.0

Saint Louis University

4.3

4.7

3.8

0.5

Southwest Baptist University

8.9

9.9

11.5

-2.6

Stephens College

6.0

8.4

9.8

-3.8

Washington University in St. Louis

1.4

3.0

2.0

-0.6

Webster University

5.1

5.6

8.8

-3.7

Westminster College

10.1

9.1

8.9

1.2

William Jewell College

5.6

5.2

5.8

-0.2

William Woods University

3.5

4.8

5.3

-1.8


Public 2-Year

Default Rate 2012

2011

2010

Difference

Crowder College

18.4

21.5

23.5

-5.1

East Central College

20.5

21.3

19.2

1.3

Jefferson College

22.5

21.8

22.5

0.0

Metropolitan Community College

18.2

18.0

20.7

-2.5

Mineral Area College

23.3

24.3

25.5

-2.2

Missouri State University–West Plains

18.9

23.1

24.0

-5.1

Moberly Area Community College

16.6

22.6

20.9

-4.3

North Central Missouri College

18.7

21.8

22.6

-3.9

Ozarks Technical Community College

21.1

22.3

20.2

0.9

St. Charles Community College

13.3

14.2

14.1

-0.8

St. Louis Community College

14.0

13.2

12.0

2.0

State Fair Community College

26.1

28.0

23.9

2.2

State Technical College of Missouri

7.6

12.1

10.0

-2.4

Three Rivers Community College

28.2

21.8

24.7

3.5


Private 2-Year

Default Rate 2012

2011

2010

Difference

Cottey College

7.8

11.7

6.1

1.7

Ranken Technical College

9.5

15.4

17.8

-8.3

Wentworth Military Academy and College

12.7

20.0

25.6

-12.9


Special Focus

Default Rate 2012

2011

2010

Difference

A. T. Still University

1.6

3.1

2.0

-0.4

Kansas City Art Institute

10.2

12.8

17.1

-6.9

Kansas City University of Medicine and Biosciences

0.8

1.3

1.4

-0.6

Logan College of Chiropractic

2.3

2.9

1.2

1.1

St. Louis College of Pharmacy

1.0

1.6

1.3

-0.3


Student Loan Default in Missouri

Like many twenty-somethings, I am kept up at night—not by noisy neighbors, but by my student loan debt. I’ll be honest—I wasn’t a smart borrower.

If there is any consolation, it’s in knowing I’m not alone. In fact, more than one-fifth of borrowers have proved to be less-than-savvy higher education investors—22% have loans in default or forbearance. The consequences of default are serious, including wage garnishment and a severe hit to credit scores.

Last month, the Department of Education released data on the default rates for colleges and universities in all fifty states and abroad. Before getting into what solutions policy leaders have proposed to lessen the burden of student debt, let’s look at student loan default rates in Missouri.

The table below shows the percentage of students by type of institution who entered repayment in fiscal 2012 and had defaulted by December 2014. The default rate for public two-year institutions or community colleges was more than double that of public four-year and private four-year universities. Private four-year universities had a lower default rate than public four-year universities by 1 percentage point. Special-focus colleges like St. Louis College of Pharmacy had the lowest default rates (with the exception of the Kansas City Art Institute, which had a default rate of 10.2 percent*). To view default rates for most colleges and universities in Missouri, click here

Default Rate by Type of Institution in Missouri
Public four-year 8.5
Public two-year 19.4
Private four-year 7.5
Private two-year 9.6
Special focus 2.6

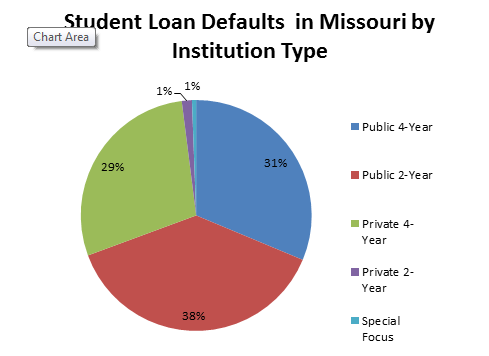
The pie chart below breaks down the students in default in 2014 according to the types of institutions they attended. This figure shows that public two-year colleges produce the most student loan defaults in Missouri (this trend is also apparent nationwide).

Why? The most common defaulters are students who attend college but do not graduate. These students  incur the debt, but don’t see any of the benefit, making it harder for them to pay back their loans. According to one study, the completion rate for students who start at two-year universities in Missouri is less than 40 percent. That’s a lot of students with debt and no degree. It’s a recipe for default. 

To combat default, some policy leaders, including President Barack Obama, have proposed further subsidizing higher education, but that skirts the real issue. What we should really talk about is how to make college less expensive in the first place and how to help more students graduate. The state could take several steps to do that.

First, it could work with schools to promote low-cost options. States like Texas and Florida have explored ways of reducing total costs to as low as $10,000. Inexpensive degrees that students successfully complete are an antidote to default; loans (if they are even necessary) have very low payments and degrees have high benefits.

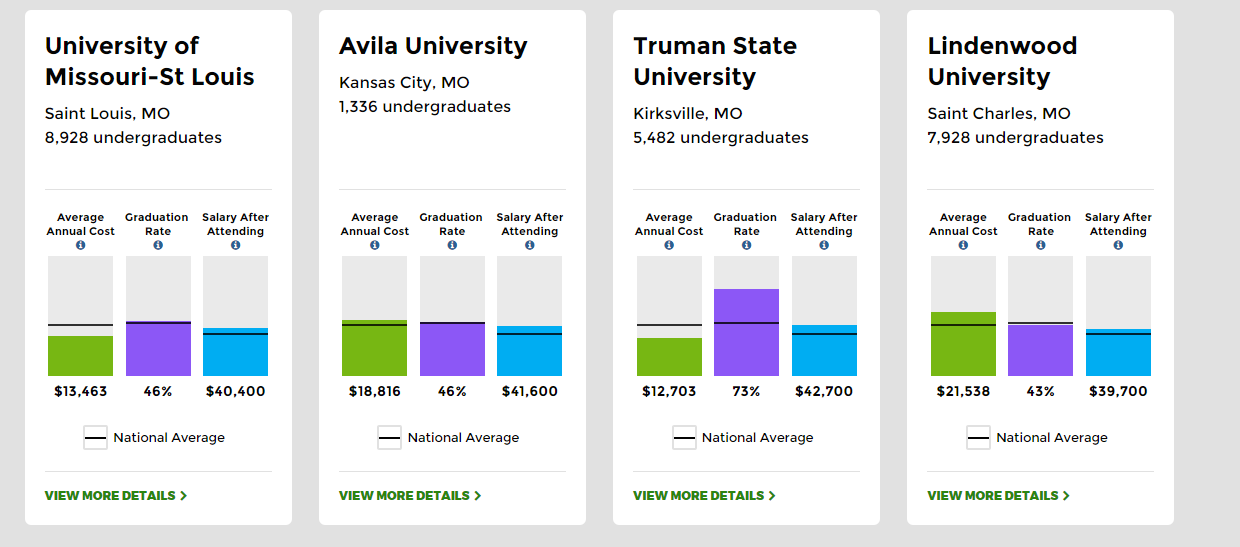
Second, the state could make both costs and benefits more transparent to potential students so they can make informed decisions and exert pressure to keep prices down. The Department of Education created the college scorecard to help students make better choices about “where to study and how to maximize their investment.” The graphs below highlight four universities in Missouri, displaying the average annual cost of attending, graduation rate, and salary after attending. The Student Right to Know Before You Go Act of 2015, an update to the Higher Education Act of 1965, was referred to a congressional committee in May and requires universities to provide more accurate and complete data.

Finally, states could force colleges to have some “skin in the game.” Under such a plan, schools would be required to pay a portion of any defaulted government loans. This would push universities to accept only students who they thought would be successful, to work with students to make it through their studies, and to help place students in jobs that will earn enough to pay back their loans.

Lower-cost options, better information, and institutions with an interest in preventing loan defaults could go a long way to helping curb debt, defaults, and the $1.3 trillion problem they create.


*The default rate for the Kansas City Art institute was originally posted as 17.1%, which was the rate reported for 2010. The 10.2% rate is correct for 2012.


Could Direct Primary Care Be An Answer to Post-Obamacare Access Problems?

Even after Congress passed the Affordable Care Act in 2010, the Show-Me Institute continued to point out the problems that the ACA not only created, but also the fundamental health policy problems it left unaddressed. Among the problems the law substantively failed to address, one of the biggest was the supply of primary care doctors. That's why it's my pleasure to share with you our latest research paper, "Where Obamacare Leaves Questions, Direct Primary Care May Offer Answers."

Along with explaining what direct primary care is and the advantages it may offer patients and doctors alike, the paper also walks through many of the problems of the ACA and outlines why those problems need to be addressed sooner, not later, if health care in this country is going to improve over the long haul. We'll have more on the contents of the paper in the days ahead.

Saint Louis and Kansas City Enjoy Low Congestion, Commute Times

Recently, the Texas A&M Transportation Institute released a report on mobility in the nation’s urban areas, specifically focusing on congestion. According to the Institute, traffic congestion is a serious problem. For example, the mobility report states that:

“In 2014, congestion caused urban Americans to travel an extra 6.9 billion hours and purchase an extra 3.1 billion gallons of fuel for a congestion cost of $160 billion.”

Direct costs aside, traffic congestion make cities more difficult places in which to live and do business. The good news for Missouri is that both Kansas City and Saint Louis actually have relatively little traffic.

                Of the 46 metropolitan areas in the United States with more than one million residents, Kansas City and Saint Louis ranked as the third and fourth least congested (by traffic indexes), respectively. In both cities, a trip that takes 30 minutes in off-peak periods only takes between 34 and 35 minutes during peak periods. In other words, rush hour isn’t really that bad in either city. Compare that to San Francisco or Los Angeles, where a 30 minute trip outside of rush hour will take about 43 minutes during rush hour.

And not all rush hours are created equal. In fact, Saint Louis might want to ditch the term altogether, because the city’s highways only experience 1.3 hours of congestion per day, meaning it’s more like “rush 40 minutes” in the morning and evening. That’s the shortest period of congestion for any large city in the United States. Compare that to Los Angeles, where the city experiences nearly 8 hours of congestion per day. It’s not your imagination, Angelenos—rush hour really does last all day.

Metro Area

Traffic Index

Rush Hours

Kansas City

1.15

2.5

Saint Louis

1.16

1.3

Large City Average

1.24

4.1

Los Angeles

1.43

7.8


Traffic congestion is correlated with a metropolitan area’s size, so Kansas City and Saint Louis benefit from not being among the nation’s largest metropolises. However, some very large cities (Atlanta, Philadelphia) have reasonably low congestion, while some cities with smaller populations (Portland, Austin) are among the top 10 most congested cities. A continuing commitment to expanding highways and eliminating bottlenecks (when necessary/possible) likely makes the biggest difference. As for Missouri’s major cities, very low levels of congestion are evidence of an adequate supply (or possible oversupply) of highway capacity. If accelerated population growth takes hold in either city, needs could quickly change, and it will be up to cities and the Missouri Department of Transportation to maintain the congestion advantages. But for now, Saint Louis residents should enjoy their “rush 40 minutes” with the knowledge that others have it much, much worse. 

For Most Teachers in Missouri, Pensions Are a Raw Deal

“Educators and education employees can focus on what they do best, educating and supporting the education of Missouri’s school children. After a full career of serving the children of this state, educators and education employees can retire with the peace of mind that they have financial security via a monthly benefit from the Systems.” [emphasis mine]

Steve Yoakum, executive director of the Public School Retirement System of Missouri (PSRS)

Steve Yoakum is absolutely right. As I have often said, teacher pensions are great for those who stay for 30 years, but they are not for those who don’t. Indeed, this was the key finding of a recent report by researchers at Bellwether Education Partners and The Urban Institute.

The report examines how the value of teacher contributions and teacher pension benefits accrue. In Missouri’s system, 29% of a teacher’s salary is contributed to the pension, 14.5% from the district and the teacher. As you might imagine, these contributions accumulate over time. Unfortunately for teachers, the value of their pension does not accumulate at the same rate because the pension is not tied directly to contributions. The illustration above shows how the value of the contributions can exceed the value of the benefits.

The report finds the break-even point for Missouri teachers is 28 years. That means a Missouri teacher must work for 28 years before the value of their pension exceeds the value of their contributions.

But how many teachers actually make it to 28 years? According to the report, just 38%. In other words, 62% of Missouri teachers are going to pay more into the pension system than they are going to get out. 

“After a full career,” Missouri’s teacher pensions are great. For those not working a full career, Missouri’s teacher pension system is a raw deal. We could fix this, and solve a host of other pension problems, by moving from a defined-benefit plan to a defined-contribution plan. Until we begin to tie retirement benefits directly to contributions, many teachers will continue to get shortchanged. 

Saint Louis teachers want a raise, and they have a point

On Friday, the Post-Dispatch covered a recent Saint Louis school board meeting where over 100 teachers vociferously argued for a raise.  Many have been stuck at the same place in the salary schedule for years, and the article mentions several popular, award-winning teachers who have left the district for other states or better paying schools in Saint Louis County.

The debate over how much teachers should be paid will never be settled.  We can, however, talk about teacher pay in the broader context of school funding and perhaps come to agreement on how teachers should be paid, if not how much.

Let’s walk through the numbers.  First, according to the Missouri Department of Elementary and Secondary Education (DESE), Saint Louis spends $14,093.21 per student per year. That reflects current expenses; it does not count capital costs, debt service, or several other significant line items. DESE also reports that the Saint Louis Public School District (SLPS) has a 1:18 classroom teacher: student ratio and a 1:12 total teacher: student ratio. 

That means that the average 18-student classroom brings in $253,677.78 in revenue per year.  Even looking at a 12-student classroom means $169,118.52 per year.  According to the Post-Dispatch, the average teacher salary is $46,163.*

Bottom line: A lot of money is failing to make it to the classroom.

How can this be? I’d have to dig deeper into the numbers for a full explanation, but even a quick glance points us in a couple of directions.  In no particular order:

1.       Administrative Bloat—According to DESE, SLPS has a ratio of 206 students for every administrator.  That compares to 272 students per administrator in Kirkwood, 274 in Lindbergh, 277 in Rockwood, 306 in Wentzville, and 321 in Mehlville.  Less money to administrators means more to teachers.

2.       A poorly designed salary schedule—Take a look at SLPS’s teacher salary schedule.   The big raises for teachers only come after they have earned degrees with dubious connections to actually improving student learning.  A great teacher who only has a bachelor’s degree tops out at just over $56,000 per year. Removing step-and-lane pay scales and empowering school leaders to compensate teachers based on quality could ensure that top teachers stay in the classroom.

3.       Pension contributions teachers won’t see—Saint Louis teachers are covered by the Public School Retirement System of the City of Saint Louis.  They are required to contribute 5% of their salary every year.  The district puts in an additional 16.5%. Now, if those teachers stay employed by the district until retirement, they can get a tidy pension, usually about 60% of their final salary (and they’re eligible for Social Security!).  The problem?  Teachers who don’t stay in SLPS for all 25 or 30 years of their career get only a fraction of that pension.  Indeed, it takes 5 years to “vest.” More than 60% leave before this time, and while they can take their contributions, they sacrifice what the district has contributed.  Contributing directly to a portable retirement account from day one of employment would ensure that every teacher gets his or her due.

Teachers are incredibly important, and they should be paid appropriately.  Unfortunately, the structure of teacher pay in Saint Louis and across the state prevents that from happening.

*Note: When originally posted, the average teacher salary was mistakenly listed as $41,163. The error has been corrected above.

Support Us

The work of the Show-Me Institute would not be possible without the generous support of people who are inspired by the vision of liberty and free enterprise. We hope you will join our efforts and become a Show-Me Institute sponsor.

Donate
Man on Horse Charging