

On Thursday, April 21, the Show-Me Institute’s Patrick Tuohey appeared on Kansas City Public Television’s Ruckus to discuss plans for a new terminal at Kansas City International Airport, the Kansas/Missouri border war, and other issues. Click on the link to watch the entire show.
Group of Mizzou Graduate Students Attempting to Unionize

A troubled Mizzou faces another challenge this week; a group of graduate students voted to unionize all of the grad students at Mizzou. The University has said it will not recognize the election, viewing the process as more of an informal “straw poll.” While this election may not be valid, the question of whether grad students can unionize will ultimately come down to whether or not these students are employees.
There are cases for both sides. Graduate students are Mizzou students working toward a post-graduate degree, such as a Master’s or PhD. Many graduate students also receive a stipend so they can focus on their scholarly duties. In addition, many grad students assist the university in teaching undergraduate students. If grad students are employees, this stipend is pay for the teaching assistance they provide.
If grad students successfully redefine themselves as employees, then they can unionize and collectively bargain. Through collective bargaining and the threat of collectively withholding labor, grad students might be able to force the university to pay them a larger stipend. If their effort is successful, this will be the first time that graduate students at a public university in Missouri have unionized.
Successful grad student unionization could turn out to be another headache for a university that’s already laying people off to cope with declining enrollment. This could affect everyone; Mizzou is a government institution, and taxpayers ultimately foot the bill.
New Regulations Only Limiting Justice?
Some Missouri lawmakers are considering legislation to regulate lawsuit funding companies on the promise of consumer protection or even tort reform, but will this help or hurt Missourians?
2016 . . . Time to Amend the Constitution?

In 1787, our Founding Fathers gave us an incredible document. But now, 228 years later, more and more Americans feel our country needs a new guiding light. Are they correct? Walter Olsen and Michael Farris debate whether the time has come to use the Article V process to amend the U.S. Constitution.
Saint Louis: Not a Tech City

Saint Louis officials constantly tout the growth of tech companies in the metropolitan area and the city specifically. Whether it’s Square’s choice to relocate to Cortex or new startups at T-Rex, city officials push the idea that the region is a rising high-tech hub. They also spend lavishly to attract more tech companies and promote tech startups. As Mayor Slay put it:
We have made a conscious decision as a community to build the infrastructure to retain, attract and grow tech companies here and support entrepreneurship. It’s one of our strongest economic drivers.
Unfortunately, the data tell a different story.
Recently, the San Diego Economic Development Corporation released a comprehensive report on the national tech sector, where it also ranked cities based on the health of their tech scene. Of the country’s 50 largest metros, Saint Louis ranked an unimpressive 28th, placing it below regional competitors like Indianapolis, Columbus, and Oklahoma City.
One of the most jarring reasons for Saint Louis’s low ranking, given the rhetoric, is the fact that the region has comparatively few software developers. The region has only 8.8 software developers per 10,000 workers, low for a large city. For comparison, San Francisco, Raleigh, and Washington, D.C., each have more than 20 developers per 10,000 workers (San Jose has more than 60). Worse yet, tech jobs actually decreased in Saint Louis from 2010 to 2014 by almost 10%. Average tech employment increased by more than 13% in the country’s largest cities during that same period. It’s hard for the region to be a rising tech hub when it has fewer and fewer software developers.
In terms of the tech sector pipeline, Saint Louis also performed poorly. The region’s residents are much less likely to have math or computer science degrees than are residents in other cities. If it’s harder to find tech talent, it’s harder to attract tech companies. One of the few bright spots for Saint Louis is money. After adjusting for cost of living, tech workers in Saint Louis get paid more than they would in most other large cities. In addition, Saint Louis attracts a decent amount of venture capital given the size of its tech sector.
To sum up, Saint Louis has established tech companies. It has startups and a tech incubator. But that can be said of almost any large American city. Taking a national view, Saint Louis’s tech growth strategy seems downright banal. As Aaron M. Renn from the Manhattan Institute put it:
Civic policy at the local level is dominated by “school solutions” that promote the same characteristics everywhere, often as a way of signaling that a city belongs in the “club.” …most cities try to look exactly the same as other cities that are considered cool, including offering bike lanes, coffee shops, microbreweries, a creative class, a food scene, and a startup culture. Even most cluster analysis seems to produce primarily a collection of the same five basic focus areas in every region (high tech, life sciences, green industry, advanced manufacturing, and logistics).
Simply having a tech scene is a natural result of being a populous region in the 21st century; it shouldn’t be taken as a sign that Saint Louis is about to have an economic transformation. The fact is, despite public support, Saint Louis’s tech scene is not a large player nationally, nor is it a terribly significant driver of the Saint Louis economy.
School Spending Inequalities Are Not Just Caused by Property Wealth

As a professor who teaches courses on school finance, I regularly hear students say that inequalities in school spending come about because of our overreliance on local property taxes. This is a common perception and is mostly true. School districts do have different tax bases. As a result, they generate different amounts of money, even if they have the same tax rate. At the same time, however, districts don’t have the same tax rates. Some tax themselves more, and others tax themselves less.
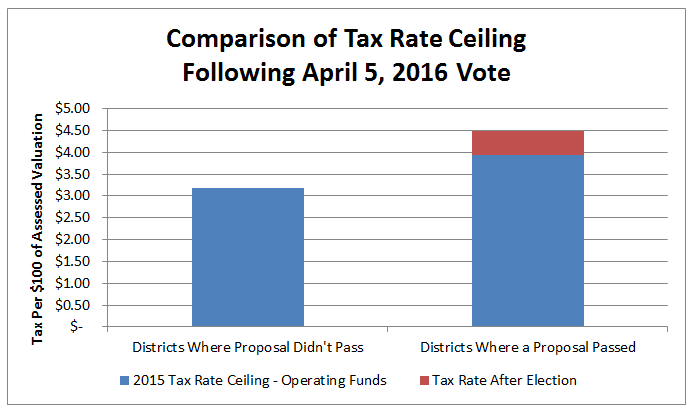
Take the results from the April 5 votes, for example. Eleven school districts proposed operating levy property tax increases—six passed, and five failed. Below I highlight the 2015 tax rate ceiling for operating funds in these school districts. The chart indicates that the districts that passed increases already had higher tax rates than the districts where a proposal was rejected.
Each of the districts is listed below. They are organized from highest to lowest based on the tax rate ceiling for operating expenses after the vote. As you can see, the six that passed also have the highest tax rates. They also tend to spend more money per pupil.
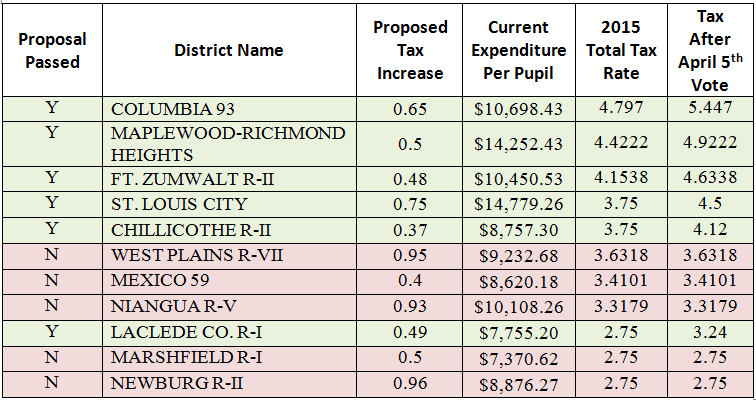
We see the same thing at the state level. Take the 50 highest-spending districts, for instance. They spend, on average, $15,537 per pupil (not weighted by the number of students). The 50 lowest-spending districts spend about half of that. The casual observer might look at this and conclude that the difference in spending was caused by property taxes. They would be partly right. The highest-spending districts tend to have more local property wealth, but they also tend to tax themselves more. The average tax rates in our highest-spending districts is $1.553 more than it is in our lowest spending districts. In other words, some of the inequalities are self-inflicted.
The state guarantees every school district a certain level of funding. This funding formula helps close the gaps between property-rich and property-poor school districts, but gaps persist partly because wealthy school districts tend to be comfortable with taxing themselves more. Indeed, the state assumes each district’s local effort will be $3.43 per $100 of assessed valuation. In 2015, 205 school districts taxed themselves at a rate lower than this assumed rate. In fact, 101 districts taxed themselves less than $3.00 per $100 of assessed valuation.
Here is the question we must consider: Are we comfortable allowing school districts to tax themselves more to pay for schools? If we are, then we are comfortable with some level of inequality. If you are not comfortable with giving districts this freedom, then what you are really saying is that you want to hold down spending in school districts, especially wealthy ones.
*An earlier version of this post incorrectly indicated that Laclede Co. R-I had failed to pass the proposed increase.
State Senate Votes to Reward A Smaller Mizzou With Millions of Extra Dollars
Despite months of unrest and national embarrassment at the University of Missouri-Columbia, it seems the folks in the Missouri Senate don't just agree with how the campus is being managed—they want to pay for even more of it. Simply baffling.
A budget bill restoring most of the Missouri House cuts to the University of Missouri and giving all higher education a 6 percent boost in funding passed the Missouri Senate on a 24-8 vote Thursday.
The UM System would receive $26.8 million in new funding under the bill, its share of a performance funding increase of $55.8 million for all colleges and universities. The bill also cuts $1 million from the allocation to UM System administration, down from the $7.6 million cut approved in the House.
First, enrollment at Mizzou itself is down. Why in the world would the Senate spend more money on fewer students, especially when the school is literally closing down dorms? Second, if a university isn't delivering the value it should for the taxpayer money being given to it, that university isn't owed another copper penny. State universities owe their funders a quality education that can be touted without embarrassment. I could even understand freezing Mizzou's budget allocation at current levels while increasing the budgets of other state schools.
But to increase state spending at Mizzou? That's a terrible message to send: one that not only condones the University's behavior, but rewards it.
Mizzou imploded last year thanks to a remarkable failure in leadership on the part of the Columbia campus. Unfortunately, it appears that failure of leadership is still rippling through state government.
What to Make of the Kansas City School Board Elections
The results are (finally) in. After over a week of vote counting—all of the candidates were write-ins because no candidate got enough signatures to qualify for the ballot, so it took a while— the Star is reporting that Natalie Lewis has been elected to the Kansas City Public School board to represent Subdistrict 1, John Fierro has been elected to represent Subdistrict 3, and Ajia Morris has been elected to represent Subbdistrict 5.
The outcome has been overshadowed by the breaking story that one candidate, Catina Taylor, is alleged to have organized an unsanctioned field trip from the school where she was substitute teaching to have students help her campaign.
But, setting that nugget aside, let’s look at the results, because I think they tell us something interesting.
According to the American Community Survey, there are 148,810 individuals of voting age who live within the boundaries of the Kansas City Missouri Public Schools. That means that Lewis, with 1,852 votes, was elected by 1.2% of voters. Fierro, with 554 votes, was elected by 0.4%, and Morris, with 651 votes, was elected with 0.4%. Even if you divide the total population by 6 (for each of the 6 subdistricts), they earned the support of 7.4%, 2.2%, and 2.6% of their subdistrict’s voters, respectively.
As I have written before, a common argument of those opposed to school choice is that the only way for families and the community to have a voice in the public education system is to have elected bodies oversee the schools. Given these results, just how representative of the body politic were these candidates? What is their mandate?
Elections are decided by those who show up, and I’d like to give the candidates credit for sticking their necks out and running in a tough environment for an unattractive job leading an unpopular organization. But moments like this are an opportunity to take stock and think about where the community’s involvement is in education. It clearly isn’t in the large, bureaucratic, top-down school district.
Design-Build and Save

My colleague Joe Miller recently published his paper on funding the Missouri Department of Transportation. In it, he refers to a successful program called design-build project delivery:
Currently, eight large highway projects either have been completed or are in progress using design-build project delivery, including KCicon and the new I-64/US 40. This process has resulted in significant savings for MoDOT and has improved project delivery.
Design-build differs from the traditional design-bid-build method we’ve been using for years. In design-bid-build, the design work is completed before the construction ever begins. Only after the design is finished—often by MoDOT’s own engineers—is the project bid out to contractors. While this ensures that MoDOT has complete control of the design phase, it often leads to additional expenses in time and potential change orders. MoDOT says so itself.
Design-build allows MoDOT to bid out the design and the construction at the same time. This means construction can start much sooner, and that while MoDOT has overall control of the design work, it may not all be completed before the project begins. The biggest benefit of design-build, however, is the significant cost savings.
A 2006 study by the Federal Highway Administration found that design-build projects were completed with significant time savings with little or no change orders and lower administrative costs. In Texas, design-build saved taxpayers 22 percent in costs over six years, and projects were completed 14 percent faster.
Allowing MoDOT to use design-build more often would require a change in statute. According to Missouri statute, MoDOT may use design-build sparingly and only until the middle of 2018:
The total number of highway design-build project contracts awarded by the commission in any state fiscal year shall not exceed two percent of the total number of all state highway system projects awarded to contracts for construction from projects listed in the commission's approved statewide transportation improvement project for that state fiscal year. Authority to enter into design-build projects granted by this section shall expire on July 1, 2018, unless extended by statute.
If the legislature wants to help MoDOT help itself by saving money, it ought to consider increasing the cap on design-build projects and extending them for much longer than 2018.
