While guest-hosting Mundo in the Morning on KCMO Talk Radio, Patrick Tuohey is joined by Elias Tsapelas to discuss the Missouri legislature’s effort to begin eliminating the income tax. They break down why Missouri’s tax climate is holding back economic and population growth, how a gradual phase-out could work, and why concerns about sales tax rates may be overblown.
On June 5, Patrick Tuohey, senior fellow at the Show-Me Institute, guest-hosted Mundo in the Morning on KCMO Talk Radio, where Terrence Wise of the Missouri Workers Center announced the organization had collected over 4,500 signatures, more than double the roughly 2,000 required, to force a public vote on any taxpayer subsidy of the proposed downtown Royals ballpark. The city clerk has 10 days to validate the signatures, after which the city council has 60 days to act, with a public vote expected in November.
The 2026 Missouri legislative session delivered significant progress on some of the state’s most pressing economic and regulatory challenges. Lawmakers took notable steps forward on tax reform, health care access, and occupational licensing, though important work remains. The following overview highlights some of the legislation enacted this session and several major policy issues that remain unresolved.
FORWARD MOVEMENT
INCOME TAX REFORM: HJRs 173 AND 174
Lawmakers approved a constitutional amendment for voter consideration that would authorize the eventual elimination of Missouri’s individual income tax. The measure represents the most significant advancement of income-tax reform in Missouri in years and ensures that the future of the state’s tax system will ultimately be decided by voters.
Asks Missouri voters to decide whether the state should pursue eventual elimination of the individual income tax
Allows lawmakers to modernize Missouri’s sales tax system as part of future income tax reductions
Requires local governments receiving additional sales tax revenue to reduce other local taxes
OCCUPATIONAL LICENSING: SB 1233
Expanded opportunities for experienced professionals moving to Missouri by creating a pathway to temporary licensure for individuals with at least three years of work experience in a profession from a state that does not require a license for that occupation.
HEALTH CARE: HB 2372, HB 2974, SB 878, AND SB 1233
Removed outdated barriers, allowing more patients to establish provider relationships remotely
Eased restrictions on prescribing medications through telehealth
Expanded access by allowing providers licensed through reciprocity to serve Missouri patients statewide
Expanded pharmacist authority to test and treat for common illnesses and prescribe certain medical devices
MORE WORK TO BE DONE
Despite extensive discussion, several major policy proposals were left unresolved at the close of the 2026 legislative session.
EDUCATION REFORM
Legislation intended to address Missouri’s reading crisis passed in the House but died in the Senate. Meanwhile, 42 percent of the state’s fourth graders can barely read—the worst results in 20 years.
Literacy reform
A–F school accountability grades
TAX AND BUDGET REFORM
Property tax reform
Spending restraint
The debate over Missouri’s future did not end with the adjournment of the legislative session. Voters will soon weigh in on income tax reform, and lawmakers will return next year facing unresolved questions about education, taxation, and government spending. The most difficult reforms still lie ahead.
KSHB recently reported that Kansas City homicides are down 22% compared with the five-year average, nearly two years after the launch of a coalition of city agencies and non-profits called SAVE KC. That is good news. It is not proof that SAVE KC caused the decline.
One of the most common mistakes in public policy is assuming that because one event follows another, the first event must have caused the second. Crime declines after a new program is launched, so the program gets credit. Crime rises after a policy change, so the policy gets blamed. Often, the evidence for either conclusion amounts to little more than timing.
The KSHB story quotes Jackson County Prosecutor Melesa Johnson, who said she believes SAVE KC is playing “a real role in the success that we are seeing.” Perhaps it is. The problem is that belief is not evidence.
Violence rises and falls for many reasons: gang conflicts, police deployment, prosecution decisions, demographics, economic conditions, and the churn of individual offenders. A before-and-after comparison cannot isolate any one cause.
That is why researchers do not determine whether a program works by simply comparing crime rates before and after implementation. They look for evidence that the intervention itself produced measurable changes that would not otherwise have occurred. Jackson County’s COMBAT program has long suffered from this same problem: public claims of success without rigorous evaluation.
To its credit, SAVE KC has been careful to acknowledge on its website that multiple factors influence violence trends; it does not claim sole responsibility for recent declines. That’s a welcome departure from what we’ve seen before. But public officials are already drawing connections between the program and declining violence. That may ultimately prove justified. But Kansas City has heard similar claims before.
The Kansas City No Violence Alliance (KC NoVA) offers a warning. KC NoVA was once praised as an innovative violent-crime strategy. But a U.S. Department of Justice review found no statistically significant effect on homicides, group-member homicides, or aggravated assaults after two years.
In 2014, city leaders were celebrating the lowest number of homicides since 1972. Public officials were quick to claim credit. “We’re making progress,” proclaimed then-Mayor Sly James, citing targeted police work, community engagement, and anti-crime initiatives for the decline. But after homicides continued to rise in subsequent years, Mayor James’s confidence disappeared.
The lesson is not that violence-reduction initiatives never work. The lesson is that confidence should follow evidence, not precede it.
Rather than asking whether a new program coincides with lower crime, reporters should ask what evidence exists that the program caused the decline. Has an independent evaluation been conducted? Are outcomes being measured against comparable groups? What metrics are being tracked? How will success be defined? What would constitute failure?
Lower homicide numbers are worth celebrating. But celebration is not evaluation. Before officials claim victory, and before reporters repeat the claim, Kansas City deserves evidence that the program worked.
There is a saying in areas prone to significant flooding that “floods bring their own rain.” Like many legends and old wives’ tales, it isn’t scientifically true, but it has a hint of truth to it. In the days after a massive flood—the kind that Missouri is prone to experience—the enormous amount of water sitting in areas it normally doesn’t can generate so much evaporation so quickly that it seems to rain more frequently. Again, I’m not saying it’s true, but it offers an interesting comparison for data centers in Missouri.
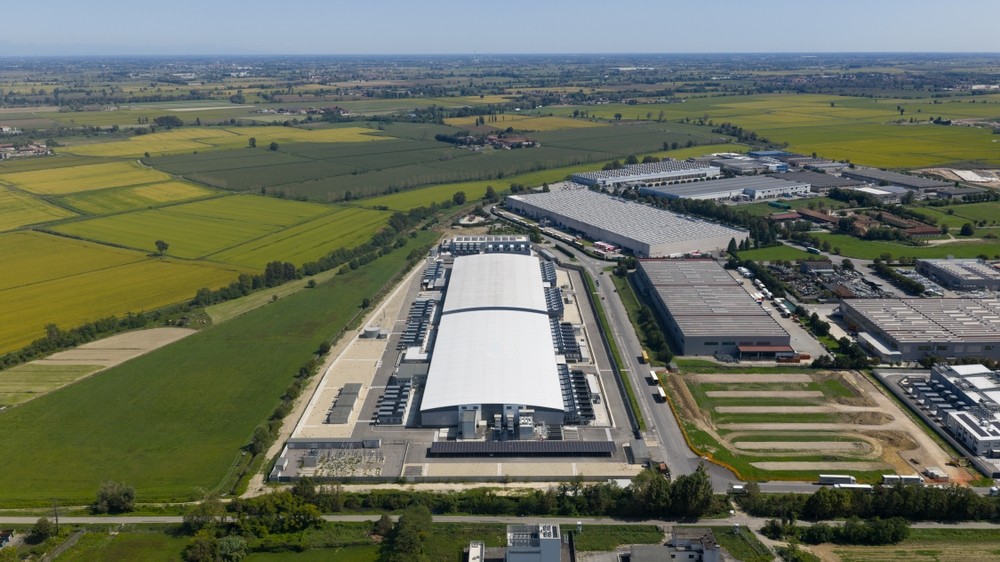
When data centers go into smaller cities or rural areas, the assessed valuation they add is so large that it should generate substantial property tax cuts for all involved. How large a difference are we talking? Google just announced plans to build a $15 billion data center in Montgomery County, in east–central Missouri. It remains to be seen how much of that investment will be reflected in property tax totals, but since the largest expense is going to be for the very expensive equipment in the data center itself—and that equipment is taxable—we can safely assume the assessed valuation of the final project will be enormous and almost certainly measured in the billions.
This for a county that had an entire assessed valuation in 2025 of $315 million. Again, that’s every farm, house, car, tractor, building, boat, and cow in the county. Google intends to build the county’s second enormous data center, with an assessed valuation in the billions. Data centers don’t have kids who need teachers. They don’t require much in the realm of public services. What do you think happens when you add huge assessed valuations from businesses that don’t add much to the public service requirements? The answer should be tax cuts, which is exactly what happened in Loudoun County, Virginia. The only way these data centers won’t generate large tax cuts is if the local elected officials make a big mistake and approve massive tax subsidies for them.
Which, of course, is exactly what they will do. Montgomery County officials gave Amazon a huge tax subsidy, just as Festus and Independence city officials did with their data centers. So instead of widespread tax cuts for an entire community, you get, at least in the short and medium term, huge tax cuts for the developers, which might result in slightly reduced taxes for everyone else. Local officials have it all backward. We should use the resources that make Missouri attractive to data centers and promise tax cuts for all instead of special subsidies for a few.
Susan Pendergrass speaks with Judge Glock, director of research and senior fellow at the Manhattan Institute and contributing editor at City Journal, about the growing debate over data centers in Missouri and across the country. They discuss why some communities are banning data centers while others are welcoming them, how Loudoun County, Virginia became the global epicenter of data center development and what it has meant for local tax revenue, whether concerns about noise, aesthetics, and energy use are valid, and more.
Susan Pendergrass (00:00): Thank you for coming on the podcast again, Judge Glock. We’re going to talk about something that is certainly in the news and certainly good and bad for Missouri in the past week. We’ve had stories about both new data centers being announced and more communities banning them. What’s your take on that? You live in Virginia. In Missouri, we are certainly at odds with each other between one area that is going to have both a massive Amazon and a massive Google data center and then very close to that a large county that just banned them. Where do you think this is going?
Judge Glock (00:36): In some sense, it’s going the way of a lot of American projects in that there’s going to be a diversity of local responses to them, which I think is actually quite OK. One of the things I gather when I talk to some of my friends across the pond in the UK or in Europe is that they basically have to have this grand national debate about data centers, whether to allow them and where to allow them. That’s obviously an important and worthwhile debate, but in America what we’re going to have, and what we’ve already had, is a near infinitude of local debates about data centers. I think that’s the right path. When you nationalize or centralize these issues, you create more veto points for people who want to refuse any sort of growth. You also force certain kinds of growth on people in areas that aren’t necessarily favorable to them or most likely to benefit from them. The American system of fairly decentralized governance, combined with a fiscal horse-trading side where the main benefit of local data centers is the fiscal bump local communities can get, I think is going to lead to a more positive outcome than a more centralized system that tries to create a single answer for a whole country or state.
Susan Pendergrass (02:07): But we have at least one county in Missouri that within the last few days said, regardless of the money, we’re a community and these things ruin towns and communities. I wonder if it isn’t going to be like driving across some states like West Virginia where the biggest, ugliest, most pollution-spewing plants are there. I wonder if it’s because Virginia was willing to have them. Now you have these communities in Missouri that are like, we’ve got acres and acres of land and we don’t care what it looks like, versus these other communities that are saying we don’t want big white buildings everywhere. That to me is a very interesting dynamic, because I feel like they’re going to end up in places where nobody wants to build anything else.
Judge Glock (03:02): Yeah, and that might not be the worst outcome. Can I give a quick segue into the history of something called environmental racism? This was a movement started to some extent in the South in the 1970s and 1980s to meld general anti-industrial, pro-environmental sentiment with the burgeoning civil rights movement. The argument at that time was that evil polluters were forcing their factories into places that were poor and largely Black or minority-majority areas, and that this was a travesty because it was burdening people with increased environmental harm, pollution, and factory soot. The problem with that analysis, which has been carried out by the federal government for decades, is that a lot of times poor and minority communities really, really wanted these factories. They were willing to accept the trade-offs of the environmental harms for the fiscal and monetary benefits in a way that wealthier communities were not. Precisely because they were poor, they usually put a lower value on the environmental concerns that exercised a lot of high-income people and put a much higher value on getting good jobs and all the rest. There’s a famous case from the 1990s where I believe the Clinton administration sued a Louisiana parish and a company that was trying to place a factory in a majority-minority district, claiming it was an example of environmental racism. It actually turned out that the largely Black politicians in the local area were saying this was insane, that they were being sued by the federal government for being racist against themselves when they wanted the factory. That’s a long segue into environmental racism, but I think it’s the sort of analysis we should apply to data centers. There are going to be some areas that put a higher value on the fiscal benefits of data centers than others. On the whole, I imagine those will be poorer areas that care a bit more about reducing property taxes and perhaps the fairly small but not insignificant job benefits of data centers. Estimates suggest a finished data center will create around 50 or so permanent jobs, though certainly hundreds during construction. Some of those communities will be more likely to accept them than maybe wealthy suburbs or other areas that don’t want them for various reasons. Now there are exceptions to that general framework, and I’ve written a bit about Loudoun County, which is a very strange case study.
Susan Pendergrass (06:02): Tell me about that, because I’m surprised that it’s the data center capital of the world given what I’ve seen in Loudoun County.
Judge Glock (06:08): I happen to live in Fairfax, Virginia, in part of the suburbs, and grew up in the general area. So it surprised me to learn not too long ago that Loudoun County, just a little further west from Fairfax, a county generally considered ex-urban and rural, and by one measure, median income, the richest county in America, with a median household income of around $170,000 a year. And yet despite this reputation as a wealthy Northern Virginia ex-urban community, what Loudoun has actually become is the global epicenter of data centers. By some measure, the amount of gigawatts used by data centers, the only place close is Beijing, and they’re not even close, at about half the level of what Loudoun and Northern Virginia have. As I showed in an article I wrote for City Journal that got some attention, that came from a particular confluence of events, a history of Defense Department buildup that left a lot of what’s called dark fiber in the area, which created what’s known as low latency, meaning data centers there could communicate with each other very quickly. That made it a good place to locate internet and communication-focused data centers, and today data centers focused on inference for AI, that is the answering of AI queries. That history made it a particular location. But the other side of the Loudoun story is that for decades, and especially in the last decade, the county just recognized the fiscal benefits. Right now data centers are paying for 45% of all taxes in the county, which is pretty remarkable.
Susan Pendergrass (08:12): How much are they taking in from data centers in person?
Judge Glock (08:15): For the next fiscal year, the estimate is that data centers will bring in $1.3 billion in county revenue. That’s about 45% of all local tax revenue. But maybe an even more startling way to frame it is that all local government uses and projects outside of schools are a little less than what Loudoun raises from data centers alone. So the local residents of Loudoun County effectively get free police, free firefighters, free animal control, free roads, and so on.
Susan Pendergrass (09:00): Have they lowered their property taxes?
Judge Glock (09:02): Yes. Thanks to this absolute boom in data center revenue, Loudoun not only has very well-appointed and well-funded schools, roads, and police departments, but they’ve also lowered their property tax rate pretty continuously for over a decade. It’s about 40% lower than it was in the early 2010s. Now that’s offset to some extent by increases in assessments and other rates, but it is much lower than what I pay over here in Fairfax, about a third lower. So data centers for Loudoun, which can kind of be seen as the first area to really embrace them, and home to one of the first significant data centers in America built by a now large firm called Equinox in the late 1990s, has worked really, really well for that county. I don’t think it’s necessarily going to work as well for every possible county that doesn’t have the same advantages Loudoun does, but it does show that for those that embrace them, there can be real benefits. It clearly hasn’t hampered the ability to attract high-income, well-funded residents with good jobs and a nice community. On the whole it seems to have been beneficial, even if you’ve seen growing opposition there as you’ve seen elsewhere.
Susan Pendergrass (10:46): Virginia horse country. But now it feels like the word is out and people are hearing that there could be health risks, that the buildings buzz, that they use all the water. I’ve seen some recently that have like some blue stripes and stuff on them, but the originals were pretty plain. The latest vote in Missouri was in St. Charles, and people cheered and wrote all these emails saying we don’t want them in our backyard because of health risks and noise. How valid are those concerns?
Judge Glock (11:22): Before I was celebrating the local diversity of responses to data centers relative to the alternative, but I don’t want to slight the classic concerns with local NIMBYism, the not-in-my-backyard movement, or the idea that local governments often try very hard to restrict new development of housing or other projects in their area, which can be a substantial burden for people looking for housing or hoping for jobs and fiscal revenue. On the whole, I think the competitiveness of local governments will help wash that out. If St. Charles or another county refuses to build a data center, it’s often not too difficult to find another county willing to accept one. But I do think a lot of this anti-data center hysteria is driven by people with not just local concerns, which can be legitimate though to my mind often vastly overblown, but with a general anger at technological civilization and AI writ large. A lot of that has been strangely channeled into specific local opposition to data centers. That old leftist slogan of think globally and act locally presents a problem here: a lot of local issues don’t really map well to global concerns about climate change or AI. If someone has an issue with AI and they ban a local data center, that is in no way going to stop AI. Stopping a data center nearby is not going to stop the revolution. It will barely even slow it down. There is a lot of generalized opposition to modernity and technology that gets channeled into opposition to local data center construction, which is totally irrelevant to that debate. As for the actual local concerns, when I was reporting on the story for Loudoun, I spent some time driving around and checking out these data centers. For those who have not seen one, or frankly a park of them, it’s a pretty amazing sight. These things can be huge, nearly approaching a hundred feet tall, very solid concrete boxes, not often the most beautiful structures you’ve ever seen. The trend now is placing blind windows in them randomly to make them look better, though depending on your preference that may or may not help. I think a lot could be done to address the aesthetic concerns. Those are real. If you look at some parts of Loudoun and elsewhere, there are data centers built right next to housing subdivisions, and it can feel uncomfortable to have a looming concrete block right next door. The other local concern I think is somewhat legitimate but again overblown is the noise. Data centers, mainly because of their cooling systems, emit a fairly regular hum. It’s a low frequency, low decibel hum, but at a low frequency it can go through walls and subtly shake things. It can be irritating. I personally would not like a low frequency hum right next door. But the solution, as with the visual impact, is simply to push them back a bit. This is not like a local school that needs to be right next to a subdivision. If you’re talking a few hundred yards down the road, you’ve pretty much solved most of the hum and visual impact issues, especially if you surround it with some trees or berms or other methods to both hide the structure and limit the noise. Those two issues, the noise and the visual impact, are real. I understand why people are concerned, but they can be and have been easily addressed. In most of the debates you see, that’s not really the issue. It’s these generalized concerns about AI or false concerns about water.
Susan Pendergrass (16:03): What about the use of energy?
Judge Glock (16:19): Again, to some extent this is another local versus global problem where the local energy use of a data center is not really going to change the price people pay on their local residential energy bill. Most energy here in Virginia and elsewhere is part of a big interconnection, which is a market where different energy producers and power plants share electricity across large transmission lines. The price for electricity, besides state-level mandates, laws, or environmental regulations, is usually determined in that general market. Yes, a data center will drive up electricity costs somewhat in that general market, but it’s not necessarily a substantial driver of that. One new data center will have a very minimal impact on anybody’s bills across the whole region and will have no real effective impact on somebody’s local energy bills. To some extent, data center builders have also been doing a lot more work to construct what’s called off-the-grid or behind-the-grid energy production attached to the data centers. That can be problematic because of increased noise, even in Loudoun and elsewhere where a lot of places just have backup diesel generators that can produce a loud crack when the backup energy turns on, since data centers want to be running constantly. But in general, as before, you have very localized concerns about noise that you want to address with very localized attempts to limit those impacts, either through distancing the data center or finding ways to cover it and limit the noise it emits. The electricity issue is real in the sense that demand for electricity is going up because of data centers, and as economists like to say, supply is inelastic, meaning supply of energy is not going to ramp up as quickly as demand. That means prices are going to go up a little bit nationally because of that. But as long as the value of these data centers is there and people are going to build them, they’re not really going to have a meaningful impact on local electricity prices, and the data center builders are going to find other ways to get electricity and make sure that generation capacity comes online.
Susan Pendergrass (19:28): Missouri is building these two massive data centers not far from our one nuclear plant, and I know that’s something that has been discussed. When I hear that Loudoun County was the first to do this in such a massive way that they could bring in half of their income from data centers, it feels to me like when Colorado legalized cannabis and was the only state to do so. They took in so much money that residents got money back on their income taxes, and every other state said they were going to be just like Colorado. But Colorado was the one that did it first. Maybe Loudoun is the one that did it first with data centers. So now when a community brings in a data center, it’s not going to have the same impact it had in that first wild test case that was Loudoun County, right?
Judge Glock (20:18): I think that’s correct. I would note though that for some smaller communities, especially small rural communities with relatively small populations, such as some of these Texas counties, a single data center can become a third or more of the city’s or county’s budget overnight. So they can have a huge impact on smaller and poorer areas. But do most data centers as they’re built today have the huge fiscal impact that Loudoun got? Absolutely not. The other side of the fiscal story, though, and one that will apply more universally, is that data centers require very little in the way of services. When a city allows a new subdivision or apartment building, it gets more property taxes but also has to pay for schooling for the kids, roads, fire departments, and all the rest. When a city allows a new office park, there are similar property tax benefits but fewer service costs than residential development. According to one estimate I saw, for every dollar a typical office building or commercial retail project generates, a city spends about 25 cents on actual services to it. For data centers, because there’s basically no one in them, that number drops to about four or five cents. They basically need nothing. As I talked to some of the local officials in Loudoun, they said these things don’t send kids to school, they don’t even put cars on the road. There’s basically no impact on anything else. Once it’s built, it just sits there and throws off property tax revenues. No trash pickup, no breaking up fights at a local bar. It’s just money that keeps flowing in. So even if the property taxes aren’t as massive as they are in Loudoun, local communities still aren’t going to have to worry much about services, and they’re still likely going to see a big net benefit. Some people point out that data centers don’t offer many jobs over the long run, and a lot of industrial projects get approved because of job creation. But the flip side is that very few jobs also means low services and low impact. A big concern with local communities approving projects is traffic, and data centers just don’t create much of it for their size. So yes, other counties are not going to get the kind of deal Loudoun got and still is getting, because it remains the epicenter and data center builders want to build next to other data centers. But they are going to get a project that really doesn’t cost much of anything, still throws off at least some money, and doesn’t really burden local communities as long as it’s placed ever so slightly out of the way.
Susan Pendergrass (24:16): That brings me to another point. I’ve read that there are a lot of very smart engineers working on the problem of AI inference and how much energy and space it requires, and how to make it more productive. Eventually I think they’re going to solve this. We used to have server rooms that every business kept cool, and then everyone ended up with a laptop or even a phone. Eventually I think people are going to address this problem of requiring so much physical space to do what we need to do. I wonder if in a decade we’re just going to have empty white blocks sitting around because it’ll be too expensive to demo. What do you think?
Judge Glock (25:08): It could happen. You mean the data centers will be depopulated of their servers because they’ll be so miniaturized. That’s true, and it could be. To some extent, counties like Loudoun that have benefited massively from these data centers can and have set up rainy day funds, similar to counties that get a sudden oil influx, to say that if this ever starts to peter out, they’ll still have a long-term benefit they can continue placing into their budget and at the service of their residents. Right now I think we’re so far away from a potential data center bust that it really shouldn’t be a concern. As I’ve also pointed out, right now about one and a half percent of our whole economy is spent building data centers. This is just from basically zero just a few years back. This is a wild building boom, absolutely wild. We’re talking hundreds of billions of dollars a year. We need, if anything, to make sure that people can build out those data centers to do the other things that the AI revolution is going to require and demand, no matter what local opposition one county or another expresses. When you talk to people in the industry, the consensus is that we just can’t even build them fast enough. If very smart companies and very smart people are willing to invest hundreds of billions of dollars a year in data centers, and when I say data centers I mean mainly the servers and computers in them, I think they know it’s going to be a good return.
Susan Pendergrass (27:09): Well, it’s going to be interesting to see it play out in Missouri, because there’s definitely been backlash coming through the local town councils and the voters have been pretty loud in some areas. Have any Virginia counties banned them that you know of?
Judge Glock (27:29): Virginia has not only been the epicenter of the growth of data centers, it has been the epicenter of the opposition to data center movement as well. There is a group, something like Data Center Reform Watch, that has been monitoring local opposition. You’ve seen a bunch of counties take pretty strong steps against new data center construction. I forget if they’ve gone all the way to a formal and complete ban, but you definitely have votes in major counties either to block individual sites or to ban them from large swaths of the county. My take is that some other county is going to want and find ways to get those data centers, and when some of these counties realize they may have gone a little too far, they’re going to look at ways to pare it back and focus more on where to place the data centers rather than banning them outright and everywhere. I really struggle to find the logic in a local community banning a data center that’s going to be two and a half miles from anybody else. Frankly, as weird and big as they are, are they that different from, say, a local warehouse? A warehouse has trucks coming in and out all day, spewing pollution. One of these fulfillment centers is a big concrete box just like a data center, but with all that traffic on top of it. Data centers just seem much less problematic in that regard. In some sense they’re like a warehouse without all the trucks. If not for this huge generalized concern with AI, which is a separate debate, there doesn’t seem to be a lot of logic to just banning them completely.
Susan Pendergrass (29:42): Well, it is early days. I would love to have you come back again to talk to us when the dust settles a little bit, especially in Missouri. One of the first places I remember reading about a ban was Festus, Missouri, and now there are more. I’m also hearing about some of the biggest data centers going in there. So we’d love to have you back.
Judge Glock (30:02): That’d be great. I look forward to it.
Although very little was done this legislative session to impact education in Missouri, legislators in Jefferson City stepped up their commitment to expanding educational freedom. Lawmakers approved $60 million in state funding for the MOScholars program, a $10 million boost over last year’s appropriation. Paired with a recent Cole County Circuit Court ruling confirming the constitutionality of using public funds for these scholarships, the program will be on its most solid foundation yet in the upcoming school year.
MOScholars isn’t a hypothetical policy experiment anymore—it is a rapidly scaling alternative for families across our state. In just four years, student participation has gone from just over 1,300 students to nearly 6,500. The state treasurer’s office reported a massive surge in applications early this spring, indicating that even more families would like to participate in the program this fall.
It is likely that the number of scholarships will expand even further in the near future. Governor Kehoe recently announced that Missouri will opt into a new federal tax credit program, allowing any U.S. taxpayer to redirect up to $1,700 of their federal liability toward school choice initiatives in any participating state, including Missouri.
When we fund students rather than systems, we create an environment where every child has a path to success. The legislature’s decision to back the growing demand for MOScholars with a $60 million commitment shows that parental empowerment is no longer a fringe priority. Now, the focus must shift to ensuring this funding flows transparently, efficiently, and directly into the hands of the parents who know their children’s needs best.
Is Missouri finally starting to treat telemedicine like modern healthcare?
As I’ve written many times, during the COVID-19 pandemic, Missouri became one of the nation’s leaders in telemedicine access. Patients gained easier access to remote care, providers gained greater flexibility, and many Missourians discovered firsthand how technology can reduce barriers to healthcare.
Unfortunately, when the public health emergency ended, many of those reforms disappeared. Over the past several years, lawmakers have worked to restore some of that flexibility, and this year’s legislation represents another meaningful step forward.
There are currently several bills (House Bill 2372, House Bill 2974, and Senate Bill 1233), awaiting the governor’s signature that would accomplish a few things. Under current law, providers generally must establish a physician–patient relationship before treating someone through telehealth. The new legislation makes that process more flexible by allowing providers to determine when a relationship can be safely established remotely.
The bills also make telemedicine prescribing more practical by focusing on whether a provider has enough information to appropriately diagnose and treat a patient instead of relying on rigid restrictions surrounding questionnaires or telephone-only evaluations. Perhaps even more important, providers licensed through Missouri’s reciprocity system will have clearer authority to provide telehealth services to Missouri patients. That means patients are no longer limited to the providers located near where they live and can more easily connect with healthcare professionals across the country who are willing to treat Missouri patients.
These changes may sound technical, but their impact could be significant. Much of Missouri continues to face healthcare provider shortages, particularly people who live in rural communities or who require care in specialized fields. Patients often wait weeks for appointments, travel long distances for care, or delay treatment altogether. None of this is to say telemedicine can solve every healthcare access challenge, but it can help connect patients to providers more quickly without requiring new facilities or providers to relocate.
The reforms also demonstrate a reality that has become increasingly clear over the past decade: telemedicine is now a key part of the healthcare system. Patients routinely use remote care for follow-up appointments, consultations, behavioral health services, and many other healthcare needs. Providers have invested heavily in telemedicine technology, and patients increasingly expect those options to remain available. As healthcare technology evolves, state laws should continue adapting so Missourians can benefit from those innovations.
All this is to say there is still more work to do. Missouri should continue moving toward a more modality-neutral approach that focuses on the quality of care rather than the technology used to deliver it. Lawmakers should also continue expanding telemedicine options for providers working within their existing scope of practice and further remove barriers that prevent qualified out-of-state providers from treating Missouri patients remotely.
Missouri may not yet be the telemedicine leader it was during the pandemic, but this year’s reforms move the state further in that direction. Addressing Missouri’s healthcare access challenges will require moving beyond outdated assumptions about how care should be delivered and focusing instead on whether patients can safely access the care they need.
Missouri has seen a lot of improvements in occupational licensing policy in recent years. Senate Bill (SB) 1233, if signed, would make another improvement to our already strong licensing framework.
Missouri’s universal reciprocity regime allows most licensed professionals from other states to have licensing requirements waived when they relocate to the Show-Me State. But what happens when a professional moves to Missouri from a state that does not license their occupation at all?
Senate Bill 1233 creates a new pathway for those individuals. Specifically, it offers a temporary license to individuals with at least three years of work experience in an occupation or profession in states that do not require a license.
For example, Missouri is one of 31 states that requires a license to work as a sign-language interpreter. Without SB 1233, if a sign-language interpreter with three years or more of experience from one of the 19 states (and the District of Columbia) that don’t require licensing moved to Missouri, they would have to spend the time and money to acquire a license before they could work here.
This bill would allow experienced professionals to continue working while pursuing a permanent Missouri license.
There are still additional improvements that can be made in occupational licensing. For example, in the licensing reciprocity process, relevant oversight bodies can still wait up to six months to issue a waiver for an applicant. A six-month waiting period is far too long.
Every occupational license carries real costs, including the loss of time and income while waiting for approval. The central question in occupational licensing is whether these costs are justified by clear and demonstrable benefits to public safety or product quality.
SB 1233 lowers the costs for experienced professionals from license-free states. It also lowers barriers to entry, which can increase the supply of professionals in different sectors and place downward pressure on prices for consumers. Missouri policymakers should continue to evaluate which existing licensing requirements function as legitimate safeguards and which function primarily as barriers to entry and work.
Support Us
The work of the Show-Me Institute would not be possible without the generous support of people who are inspired by the vision of liberty and free enterprise. We hope you will join our efforts and become a Show-Me Institute sponsor.