The Power & Light District Still Hasn’t Delivered

On Ruckus last week we discussed the city’s debt and its profligate spending on the Power & Light District downtown. In the segment, I asserted that ten years ago, “Kansas City fell all over itself to try to build an entertainment district. It hasn’t created any new jobs; it hasn’t created any new businesses.” How can that be—isn’t it evident that downtown has seen a rebirth?

As I’ve written before, most of these taxpayer subsidies result only in economic diversion. They don’t create anything new; at best they just move development to different areas. The H&R Block headquarters for which taxpayers paid didn’t create the new jobs that were promised; it merely consolidated jobs from across the area to one place. Likewise, as the chart below shows, the Power & Light District didn’t create new jobs or businesses, but instead simply relocated them from elsewhere. 


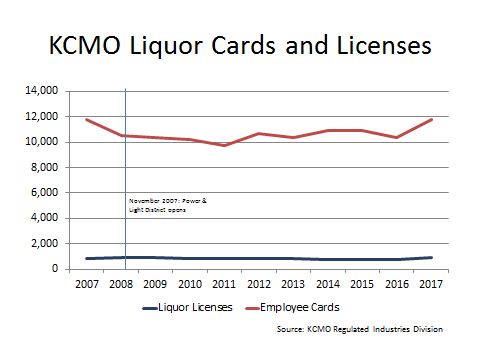
The number of bars and restaurants (and their accompanying jobs) remained flat in Kansas City for years after the Power & Light District opened. If the Power & Light District had been the success that city leaders claimed, you’d have seen an uptick in employee liquor cards and licenses. But citywide, the numbers were flat at best. This means that any new jobs and businesses downtown merely came at the cost of jobs and businesses elsewhere in the city. Nothing new was created. Only now, as the economy improves, are those numbers going up.

 Focusing on reviving downtown Kansas City might be a worthy goal. As I wrote last year,

Policymakers are free to argue that diverting economic activity from elsewhere in Kansas City to the downtown area is good policy. That would be a welcome policy debate worthy of consideration. But supporting policies that merely move activity around and then pretending something new has been created is not only disingenuous, it is unsustainable.

The rest of Kansas City has needs, including basic infrastructure and greater police presence. Focusing on downtown hasn’t provided any net benefit, and it has cost us dearly.

Map: Medicaid Spending and Enrollment by County in 2016

Recently, Patrick Ishmael, Show-Me’s Director of Government Accountability, pointed out that Medicaid spending is increasing in Missouri at an alarming rate. Even though some downplayed the 6.2 percent growth in spending, there is cause for concern. The Medicaid budget increased by nearly $570 million from FY2016 to FY2017. Additionally, Ishmael notes that Medicaid’s share of the budget has risen from 18.4 percent in FY2000 to over 37 percent in FY2016.

Since Medicaid is such a large part of state spending, it is worth taking a closer look at where and how this money is being spent. Below is a map that shows the percentage of counties’ populations enrolled in Medicaid, also known at Mo HealthNet. The data table, provided by the Department of Social Services, can also be sorted by expenditures, enrollees, and percentage of the population for each county.

The data displayed are from FY2016; in FY2017, another $570 million and 26,948 enrollees were added to these numbers. This information could help provide a clearer picture of Medicaid’s costs and the variation in participation rates across counties. With such information, lawmakers and taxpayers can better understand how changes—whether cuts or expansion—to the program would affect the state.

Map: Missouri State Government Spending in FY2017

Last month the Show-Me Institute published an extensive dataset of state spending from the Office of Administration, stretching back to FY2000 and through FY2017. You can find the spreadsheets, broken down by quarter, here. Given the success of the Municipal Checkbook’s app, we decided to render one for the state for the past fiscal year. You can find it below.

Users can scroll through the vendors with whom the state did much of its spending, zoom in on a map of vendors to see who does a lot of business with the state in your neighborhood, and look at spending and transaction patterns between the state and vendors over the course of the year.

Have a thought or suggestion about future visualizations? Leave a comment below. And be sure to give the app a minute to load; after all, it’s processing over a million transactions.

A Streetcar Undesired

As Omahans consider spending hundreds of millions of dollars for a streetcar system, proponents point to Kansas City as an example of a successful system. But the claims about Kansas City’s success are grossly overstated, and voters reject the system almost every time they are given a chance. I hope Omaha can learn from our misadventure.

It is noteworthy that in the age of driverless cars, some want to look backward to the inflexible fixed-rail technology of the 19th century. In Kansas City, when we get icy weather, the streetcar system is shut down and replaced with buses. And when even a single streetcar is involved in an accident or breaks down, the whole system is shut down. Streetcars cannot reroute themselves; they cannot drive around an accident. As neighborhoods grow over time, fixed rail routes cannot shift as demand shifts. Streetcars are literally and figuratively stuck in a rut. And on top of this, streetcars cause traffic congestion because they are so large and slow moving. Streetcars also fail to remove cars from the road. Research shows that streetcars really just move people away from buses, not out of their cars.

Because streetcars are such an inefficient and expensive transit option, proponents instead point to the economic development they purportedly create. Every new development is met with satisfied nods as evidence of the streetcar’s success. The research around the country and our experience in Kansas City tell another story. It’s not the streetcar that drives development, but all the taxpayer money handed out to encourage construction along the route. Abatements, cash handouts, tax credits and tax increment finance subsidies litter the streetcar route here.

On top of the subsidies, there’s the price tag on the streetcar itself. The cost of a streetcar is many times the cost of simply adding a new bus route. It is almost humorous that Kansas City raised taxes to fund a large portion of the approximately $110 million cost for 2.2 miles of track, then lowered taxes for developers to entice them to invest along the route. Imagine what would have happened if the city had skipped the streetcar and instead lowered taxes for everyone!

Omahans should be aware that Kansas City voters have been rejecting streetcars for decades. Due to an odd artifact of Missouri law, small groups of citizens can create transportation development districts and tax themselves. As a result, fewer than 400 votes cast in the district committed all of Kansas City to supporting a $110 million project. In response, activists circulated a petition requiring a city-wide vote before the Council could spend any tax money on streetcars. The petition collected the necessary number of signatures, was verified, and was passed by a vote of the people in August. But our Council declared the petition unlawful and appropriated more funds to the streetcar anyway.

Before the Obama Administration, few if any federal funds were available for streetcars. Since then, however, the spigots have been flowing—and the result has been a boom in streetcar spending in cities across the country. In several cases the percentage of people who use transit in those very cities has actually dropped.

Streetcars do look fun, however. One pundit in Kansas City refers to ours as a party bus. It’s free to ride, looks sleek, and is something new on the street. But it doesn’t help the city grow or efficiently move people where they want to go. It requires a lot of money to build and operate and requires even more subsidies along the route to create the illusion of economic growth. In Kansas City, the few (if any) benefits of a streetcar have not been worth the significant cost. Omaha taxpayers should be wary.

Solutions for Missouri’s Transportation Infrastructure

Missouri’s transportation system is critical to the state’s economy, but the Missouri Department of Transportation (MoDOT) says it doesn’t have the funds needed to maintain the state highway system in the near future. With many Missouri roads and highways needing to be repaired or rebuilt, the state will have to make some tough decisions. Learn more about transportation infrastructure solutions in our 2018 Missouri Blueprint.

Missouri Needs Criminal Justice Reform-and Fast

Incarceration rates are on the rise in Missouri, and with a larger prison population come growing costs for the state. According to the Missouri State Justice Reinvestment Task Force, if current incarceration trends continue, Missouri will have to build two brand new prisons in the next few years. The price tag to build and operate two new facilities will be $485 million over the next five years. To put that amount in perspective, the entire budget for the Department of Corrections was $725 million for 2018.

If Missouri can reduce growth in the cost of our criminal justice system through responsible reform, shouldn’t we do it? Governor Greitens’s proposed budget for FY2019 includes some of the recommendations from the task force, such as treatment courts and community-based treatment programs, but much was left out. With Missouri taxpayers staring at such a large bill, additional reforms deserve serious consideration.

Reform objectives fall within three broader categories: reducing violent crime, reducing treatment-related admissions, and reducing recidivism. Addressing each of these areas could help slow the growth of our prison population.

Let’s take a closer look at what the task force has proposed:

  • Reducing Violent Crime in Our Communities by giving more state support to local police departments, providing more support for victims, updating technology systems, and providing incentives for county jails to reserve limited jail space for dangerous offenders
  • Reducing Mental Health and Substance Abuse Treatment-Related Admissions by improving current treatment programs in prison, improving community-based treatment options, strengthening community supervision centers, and expanding behavioral health services
  • Reducing Recidivism and Readmission to Prison by amending supervision practices to reduce revocations, better preparing people leaving prison, providing proper training on risk assessment and correctional practices for staff, and supporting treatment courts

The total cost of these reforms is estimated at $189 million over the next five years—about $300 million less than the cost of building two more prisons.

With our prisons already over capacity, we need to begin thinking about reform immediately. Lawmakers have introduced criminal justice reform bills that include “Raise the Age” (requiring 17-year-olds to be tried as juveniles), mandatory minimum sentencing reform, and changes to state reimbursements to county jails. Nevertheless, additional reforms will likely be needed in order to control, let alone reduce, our prison population in the coming years.

When faced with similar circumstances in Texas—spend $2 billion on new prisons or curb incarceration rates—the legislature decided to invest $241 million in reforms instead. Now Texas is closing facilities that are no longer needed, and crime rates fell 26 percent between 2007 and 2014. With a bit more urgency, perhaps Missouri can also protect taxpayers while at the same time making our communities safer. 

Show-Me Institute Rolls out Municipal Checkbook Project

Missouri residents should be able to tell how their cities are spending their tax dollars—to make sure public officials are being good stewards of public resources. The Show-Me Institute’s Municipal Checkbook Project was started to show taxpayers how cities spend money—and who they do business with—so we can decide for ourselves if our cities are operated in a fiscally responsible manner.

Beginning last summer, researchers at the Institute sent sunshine requests to cities throughout Missouri asking for each city’s expenditure records for the last five years. So what is the cost for this kind of transparency? Well, if you live in Battlefield, you would have to cough up $35,101.60 for research, paper copies, and mailing costs. On the other hand, if you live in Salem or Palmyra, you wouldn’t be charged at all for this information.

So why is there this huge discrepancy? It is because the law does not require cities to keep their records in any specific format. Some cities keep their expenditure records electronically, which makes it easy and cheap to produce them upon request. Others keep only paper copies, which means city workers have to spend time looking for information and either scan or mail the relevant documents.

The interactive municipal checkbook database is a tool for taxpayers to use to research their city’s spending. Cities that do not maintain their records in electronically accessible formats will not be available. When a city provides information that is downloadable, the city will be be added to the database. We hope that someday, as a matter of routine, all cities will release this information online and in a format that is taxpayer friendly. If the government can spend your money, shouldn’t you be able to see how?

Support Us

The work of the Show-Me Institute would not be possible without the generous support of people who are inspired by the vision of liberty and free enterprise. We hope you will join our efforts and become a Show-Me Institute sponsor.

Donate
Man on Horse Charging