
Since 2000, growth in Missouri’s teaching and administrative staff has greatly outpaced growth in student enrollment, a trend documented in this report by Avery Frank and Cory Koedel. Browse the underlying district by district numbers yourself in the companion Personnel Boom data dashboard.
Table of Contents
Key Takeaways
- Since the turn of the century, growth in teaching and administrative staff in Missouri has greatly outpaced growth in student enrollment.
- Growth in FTE teachers: +13 percent
- Growth in FTE administrators: +35 percent
- Growth in student enrollment: –4 percent
- Personnel growth has exceeded growth in student enrollment in urban, suburban, and rural areas, and more broadly, in about 85 percent of school districts statewide.
- While staffing has increased disproportionately, teacher and administrator salaries have declined in real terms since 2000.
- If school districts had maintained their staffing levels from the year 2000 (when they had more students than today), and used the savings to raise teacher salaries, the average teacher salary in Missouri could be $10,000 higher today, which amounts to a 17 percent raise.
- Even a partial unwinding of the Personnel Boom (e.g., back to 2015 conditions) would free up resources to substantially increase teacher salaries.
Introduction
Public school spending nationally, and in Missouri, has been rising for decades. Between 2000 and 2020, excluding the recent COVID-induced spending surge, total inflation-adjusted per-pupil spending in Missouri increased by 14 percent.1 Moreover, this increase follows persistent spending increases throughout the 20th century, especially from 1950 onward.2 The sustained growth in educational funding reflects Americans’—and Missourians’—strong support for public education.
But how is all of this money being spent? To shed light on this question, we analyze changes in certified personnel expenditures in Missouri—i.e., expenditures on teachers and school administrators.3 Certified personnel expenditures represent the largest spending category in district budgets. We examine trends from 2000 to 2025 in the number of full-time equivalent (FTE) teachers and administrators, as well as their average salaries and total spending on salaries.4
We document increases in total spending on teacher and administrator salaries over time. Since 2000, Missouri schools increased total spending on teacher salaries by 1.3 percent, and total spending on administrator salaries by 22.6 percent. These estimates are in real dollars, after adjusting for inflation. We further show the increases are driven predominantly by increases in FTEs—by 2025 Missouri schools employed 12.8 percent more certified teacher FTEs, and 34.9 percent more administrator FTEs, than in 2000.
At the same time, student enrollment in Missouri public schools has declined: enrollment today is 4.1 percent below the enrollment level at the turn of the century.
The disproportionate expansion of certified staff relative to student enrollment is a robust pattern across Missouri school districts. It is present in city, suburban, town, and rural districts. It is present in charter schools. At a more granular level, of the 516 Missouri public school districts that operated in both 2000 and 2025, all but 39 increased teacher staffing at a faster rate than student enrollment, and all but 52 increased administrator staffing at a faster rate.
This raises the question of why. We do not have definitive answers, but we discuss and review the evidence for three theories. The first theory is that students are needier than ever before. The second is that schools perceive students to be needier than ever before, even if this is not true, which is an example of “concept creep” from the field of psychology. The third is that the Personnel Boom is a consequence of regulatory and administrative expansion in public education, which has increased staffing needs by generating additional compliance, reporting, and documentation responsibilities. This last theory is particularly compelling for the growth of administrator FTE, though it could explain some growth in the teacher workforce as well. Ultimately, we conclude that evidence to support the first theory is weak, and that the latter two are more plausible explanations.
Regardless of its cause, the Personnel Boom represents a real resource tradeoff for Missouri schools. The tradeoff can be quantified in many ways; we quantify it in terms of teacher salaries. Teacher salaries are a persistent hot-button issue in Missouri. In 2024, statewide legislation was enacted to raise the minimum teacher salary due to concerns over stagnant pay.5 We ask: What if instead of prioritizing increases in teacher and administrator FTE, Missouri kept the same education budget but prioritized teacher salaries instead? Under this counterfactual, we show that the average inflation-adjusted teacher salary in Missouri today could be 17 percent higher, or roughly $10,000 annually. In the face of persistent concerns over teacher shortages—exacerbated, no doubt, by the Personnel Boom—redirecting resources toward compensation represents a promising strategy for alleviating Missouri’s staffing challenges.
The Personnel Boom reflects a persistent, implicit emphasis of school districts across Missouri on expanding certified personnel. It has led to a significantly larger education workforce serving a steadily declining student population. It is time for Missourians to ask why. The Personnel Boom has been sustained through persistent educational funding increases over decades, but this cannot continue forever.
Data and Methods
Our data are from the Missouri Department of Elementary and Secondary Education’s (DESE) Comprehensive Data System (MCDS), which includes information on student enrollment, personnel, and average and total personnel salaries. We collected data from 2000 through 2025 for all Missouri school districts and charter schools.
From the MCDS we constructed seven variables for each district or charter school in each year. For teachers, we collected data on total FTE and the average teacher salary. Similarly, for administrators we collected data on total FTE and the average administrator salary. For both teachers and administrators, we also construct a measure of total spending on salaries by multiplying the FTE and average-salary variables. In addition, we collected total student enrollment.
Teachers and administrators are identified in the MCDS using DESE position codes. Administrator FTE comprises FTE from school principals, assistant principals, special education directors, career education directors, and superintendents.6 Table 1 provides snapshots of the data in 2000, 2015, and 2025.
Table 1
Snapshot of Missouri Schools in 2000, 2015, and 2025.
| 2000 | 2015 | 2025 | |
|---|---|---|---|
| Total K–12 Enrollment | 892,327 | 886,225 | 856,002 |
| Administrator FTE | 4,062 | 4,632 | 5,477 |
| Teacher FTE | 63,252 | 67,856 | 71,362 |
| Student-to-Administrator Ratio | 219.7 | 191.3 | 156.3 |
| Student-to-Teacher Ratio | 14.1 | 13.1 | 12.0 |
| Administrator Average Salary (inflation-adjusted) | $117,273 | $120,147 | $106,607 |
| Teacher Average Salary (inflation-adjusted) | $66,586 | $65,623 | $59,790 |
Source: Authors’ calculations based on data from the Missouri Department of Elementary and Secondary Education (DESE).
Note: Administrator and teacher average salaries are reported in constant 2025 dollars.
After a modest cleaning process to address anomalies in the data, which we describe in Appendix A, we normalize all variables to 1.0 in 2000. This allows for a straightforward interpretation of the trends we present below—for example, if the normalized student enrollment variable is 1.5 in the year 2010 for District X, it means District X’s enrollment in 2010 was 50 percent higher than in 2000. When we present statewide trends or otherwise aggregate the data, we sum over districts prior to normalizing, which preserves districts’ weights in the data in proportion to their sizes.
In the counterfactual portion of our analysis, we consider how teacher salaries could be different if we unwound the Personnel Boom during the 21st century and reallocated the savings to teacher salaries holding total spending fixed. We calculate the savings from (hypothetically) unwinding the Personnel Boom for teachers as:

Equation (1) shows the savings to be equal to the difference in teacher FTE between 2000 and 2025, multiplied by the 2025 average salary. To calculate the counterfactual 2025 average teacher salary absent the Personnel Boom, we take the observed 2025 average teacher salary, then add the savings in equation (1) spread over the level of teacher FTE in 2000. This yields the average teacher salary we would expect in Missouri if we had held staffing at the same level as in the year 2000 but did not reduce spending on teachers. Note this calculation is mathematically equivalent to simply taking total teacher spending in 2025 and dividing it by teacher FTE in 2000.
The analogous calculation for the savings from unwinding the Personnel Boom for administrators is:

These savings can be counterfactually distributed to teacher salaries in a similar fashion, with or without simultaneously unwinding the Personnel Boom for teachers. Note that we do not consider a counterfactual to raise administrator salaries. Our counterfactual calculations—whether the savings come from reducing teacher or administrator FTE—redistribute the savings to teacher salaries only. This is motivated by the emphasis in policy discussions, and recent Missouri legislation, on teacher salaries.
Our salary calculations are in real dollars to abstract from nominal price changes. We convert dollar values into 2025 dollars throughout. Additional details about our counterfactual calculations are provided in Appendix B.
The Public School Personnel Boom
We begin in Figure 1 by showing aggregate statewide trends in student enrollment, administrator FTE, and teacher FTE. This is the simplest illustration of the Personnel Boom. From 2000 to 2025, teacher FTE increased by 12.8 percent and administrator FTE increased by 34.9 percent, while student enrollment declined by 4.1 percent.
The increase in administrator FTE in percentage terms is larger than for teachers, though the number of administrators is lower. To give some context for the trends in Figure 1, in the year 2000, Missouri public schools employed 4,062 administrators and 63,252 teachers. At that time, student enrollment was 892,327. This means the student-to-teacher and student-to-administrator ratios were 14.1 and 219.7, respectively. Fast forward to 2025, and these ratios have fallen to 12.0 and 156.3.
Figure 2 shows complementary trends in total salary expenditures and average salaries, in real 2025 dollars. Interestingly, administrators and teachers have both seen declines in average salaries of 9.1 and 10.2 percent in real terms, respectively, since 2000. Salaries lost considerable ground during the inflationary period in the early 2020s, but even before then, they were not increasing. On net, total salary expenditures for both teachers and administrators have grown by 1.3 and 22.6 percent, respectively, driven by the FTE increases.
It is clear from the figures that Missouri school districts have prioritized expanding staff over increasing salaries.
For the most part, certified staff have increased persistently during the 21st century. The exception is around the Great Recession, where staffing ramped up quickly during the economic expansion that occurred prior to the recession, then corrected afterward. There is no indication that the upward trends in staffing are flattening through 2025.
The disproportionate growth in teachers and administrators relative to student enrollment is ubiquitous statewide. To show this, we divide school districts into four urbanicity categories based on classifications from the National Center for Education Statistics (NCES): (1) city, (2) suburban, (3) town (population centers that are too small to be city and too large to be rural), and (4) rural. Figure 3 shows that across all four categories, growth in administrators and teachers has greatly outpaced growth in students, which is negative outside of suburban districts.
Even in city school districts, where enrollment has declined by roughly 25 percent, administrator FTE has increased by 10 percent.
Figure 4 shows trends separately for charter schools, which are city but excluded from Figure 3. Data on charter school enrollments and FTEs are not available from DESE until 2007, so we begin the trends then. Figure 4 shows the Personnel Boom is clearly occurring in Missouri charter schools as well. In recent years (i.e., since the late 2010s) the growth in administrator and teacher FTEs has been disproportionate in charter schools, outpacing analogous growth in traditional public schools.
One factor that could contribute to the explosive growth in FTEs at charter schools—especially for administrators—is that they are smaller and cannot benefit from economies of scale in the same way that larger school districts can. Charter schools also tend to serve especially high-need populations in Missouri’s urban centers. In regressions that account for these factors, we find that charter schools have lower administrator and teacher FTEs than would be predicted for observationally similar traditional public schools.7 However, it is still the case that administrator and teacher FTEs in charter schools are growing faster than student enrollment.
Finally, we calculate changes in student enrollment, administrator FTE, and teacher FTE from 2000 to 2025 for every Missouri school district that remained open and for which data were available during our full sample period. To reduce the influence of noise in the data, we compare the changes at the beginning and end of the sample period using three-year averages. We find that of 516 Missouri public school districts, all but 39 increased teacher staffing at a faster rate than student enrollment, and all but 52 increased administrator staffing at a faster rate. Only 78 districts had growth in student enrollment that exceeded growth in either type of FTE.
Results for selected individual districts can be seen online in the companion data dashboard for this report, available at www.showmeinstitute.org.
What Explains the Personnel Boom?
Thus far we have documented an unambiguous empirical fact: school staffing in Missouri is up dramatically since the turn of the century, even as student enrollment has declined. But our data do not tell us why. In this section we review the cases for three possible explanations: real changes in student behavior and needs, perceived changes in student behavior and needs, and the expansion of regulatory and administrative requirements.
First, we consider the possibility that students’ real needs have changed. We argue this is not a compelling explanation for the Personnel Boom because of the Boom’s persistence and stability over the 21st century. This stands in contrast to historical indicators of student well-being, which have fluctuated during the 21st century and currently look quite favorable. For example, the poverty rate is often viewed as a general proxy of student need. Compared to the persistent upward march of the Personnel Boom, the poverty rate in Missouri has fluctuated substantially and today sits near its 21st century low.8 Related indicators—like the share of Missourians without health insurance—also indicate economic conditions are broadly improving.9
The poverty rate is a useful but coarse indicator, and it could be that students’ needs have increased even as economic conditions have improved. But this explanation isn’t consistently supported by the data, either. It is true that data from the Centers for Disease Control and Prevention (CDC) show the most extreme behaviors indicative of mental health problems among teenagers—i.e., self-harm and suicide—have increased, but they remain rare.10 Among metrics that apply to more students, most are flat or trending in a favorable direction. The share of Missouri children identified for special education services has hardly changed during the 21st century, and data from a biennial student survey conducted by DESE and the Missouri Department of Mental Health shows generally improving mental health, substance abuse, and behavioral trends.11
The Boom has also been unresponsive to external factors that have affected student well-being more recently—most notably, the rapid and widespread use of smartphones among school-aged children during the 2010s.12 The Personnel Boom clearly predates smartphone expansion, and there is no indication the Boom accelerated as smartphone use became more prevalent: Administrator FTE growth increased slightly in the 2010s but is at best weakly related to smartphone expansion, and growth in teacher FTE has been unresponsive.13
The second theory is that even if today’s students do not truly require more resources, educators perceive that they do. Psychologists refer to this as “concept creep” or “vulnerability creep.”14 For example, harm-related terms have become more broadly encompassing over time. Consider terms that have historically been used to describe physical harm but are now often used to describe emotional or psychological harm—for example, trauma, abuse, and bullying. With the broadening definition of harm, vulnerability, and the related concept of need, a population of students with the same needs as their peers 20 years ago could be perceived as having greater needs today.
Vulnerability creep may give way to mission creep, whereby schools prioritize an increasing array of nonacademic services and supports for students. Modern schools have taken on an expanded role that includes everything from developing students’ social and emotional skills, to feeding them or even doing their laundry. The “perception of need” hypothesis is a credible explanation for the Personnel Boom. There is clear evidence that schools are providing more services and supports to students than ever before, and this necessitates a larger workforce.15
The third theory we consider is that the Personnel Boom is driven by regulatory and administrative expansion in public education. More regulations and reporting rules require more paperwork, which takes time and requires more staff. This theory makes the most sense as an explanation for the administrator Boom, though teachers can be affected too.16 Unfortunately, we are not aware of any empirical evidence on how the demands on administrators or teachers have changed in this regard over time in Missouri. There is national evidence that relatively recent school reform efforts—for instance, efforts to improve teacher evaluation systems—have significantly increased school principals’ administrative burdens.17 If this is true in Missouri, and if other requirements have also increased the administrative burden in schools, it would help to explain the Personnel Boom.
Ultimately, our analysis does not speak directly to the reasons for the Personnel Boom. The persistence and stability of the Boom throughout the period we study—and even before18—is inconsistent with the theory that it is primarily a response to changing student needs. The more plausible explanations are changes in the perception of student needs and regulatory and administrative expansion.
What if We Prioritized Teacher Salaries Instead?
In 2024, the Missouri Legislature passed Senate Bill 727, which raised the statewide minimum teacher salary from $25,000 to $40,000 annually. It also increased the minimum salary for a teacher with a master’s degree and 10 years of experience, which will go from $33,000 to $48,000 by 2027–28. Polling numbers from the St. Louis University/YouGov Poll show strong support among likely voters for these changes, reflecting demand to pay Missouri teachers more.19 In this section, we assess strong support by asking how much we could have raised teacher pay in Missouri if we had focused our educational resources on pay increases rather than personnel growth. The answer: A lot.
Figure 5 shows how much we could have increased teacher salaries in 2025 under three different scenarios that unwind aspects of the Personnel Boom: (1) for teachers only, (2) for administrators only, and (3) for teachers and administrators. In these scenarios we hold teacher FTE, administrator FTE, or both, fixed over two time horizons. In the first, we unwind the Boom 10 years back to 2015, and in the second, we unwind the Boom all the way back to the year 2000.
For instance, consider the scenario where we unwind only the teacher portion of the Boom back to the year 2000, shown in the third (red) bar in Figure 5. The figure shows that in this scenario, the savings generated would allow the average Missouri teacher salary to rise by $7,666. If we unwind the Boom in both teachers and administrators, also to the year 2000, we could raise the average teacher salary by $10,052, to almost $70,000 annually. This amounts to a raise of about 17 percent.
The gains in teacher salaries from unwinding the Boom for teachers are larger than the gains from unwinding the Boom for administrators. This is because while spending on administrator salaries has grown more in percentage terms, they are much fewer in number; therefore, suppressing the surge in teacher staffing has a larger total impact. But this is not to say the administrator Boom is inconsequential—even allowing for the expansion of teachers as it happened, suppressing the administrator Boom alone since the turn of the century would allow us to increase the average salary across all Missouri teachers by over $2,000 annually, which would amount to a 3.5 percent raise.
Further note that with the decline in student enrollment in Missouri since the turn of the century, all the scenarios we consider in this section result in lower student-to-teacher and student-to-administrator ratios today than in the year 2000.20
The potential to raise teacher salaries is just one way to quantify the opportunity cost of the Personnel Boom. It is a salient example given the strong support for higher teacher pay among Missouri voters, but the savings could be distributed in any number of ways. Whether it would be feasible to truly unwind the Personnel Boom is uncertain. If not, at a minimum these calculations can serve as a reminder of the cost of allowing the Personnel Boom’s relentless expansion to continue.
Conclusion
School districts in Missouri constantly face funding decisions that require tradeoffs. Some of these tradeoffs are explicit—for example, voters may be asked to approve a tax increase to fund a new school building. But many tradeoffs are implicit, reflecting the priorities of district decision-makers. Our analysis shows that over the past 25 years, Missouri school districts have consistently prioritized expanding teaching and administrative staff over other spending priorities, including raising teacher salaries. Growth in teacher and administrator FTE has far outpaced student enrollment, and there is no evidence that this trend is slowing. Moreover, prior research suggests that this pattern is not new; the disproportionate growth in school staffing dates back well into the 20th century.21
We cannot definitively explain why the Personnel Boom has occurred, nor why it is continuing, but we consider three plausible explanations: (1) real changes in student behavior and needs, (2) perceived—but not real—changes in student needs, and (3) regulatory and administrative expansion. The data are inconsistent with the first, leaving the latter two as more likely explanations.
Regardless of the cause of the Boom, the persistent growth in personnel amid declining enrollment raises important questions about long-term sustainability and how educational resources are being used by Missouri school districts.
Appendix A: Data
Data from the Missouri Comprehensive Data System (MCDS) are based on administrative district records and are generally of high quality, though there are some missing data and some errors.
With regard to missing data, there are three broad patterns to individual districts’ missing data over time: (1) a string of missing values followed by a string of non-missing values, (2) a string of non-missing values followed by a string of missing values, and (3) districts with “interior” missing values—i.e., with non-missing values before and after. Districts in case (1) are treated as new districts (or charter schools), and districts in case (2) are treated as districts (or charter schools) that closed during the period of observation; correspondingly, the missing values are set to zero. For districts with intermittent missing values, we replace the missing values with the average of the nearest year before and nearest year after. Or, in technical terms, we linearly interpolate the missing values using the nearest observed values.
Next, we turn to data errors. To understand the errors, we began by calculating year-over-year changes in administrator FTEs, teacher FTEs, and student enrollment in all Missouri school districts over the course of the full data panel. Focusing on the FTE variables, we quickly observed that outlying FTE changes are especially prevalent in 2003. The 2003 data show that over two hundred Missouri districts had large, unexplained, single-year dips in FTE values, followed by an immediate recovery. Some of the fluctuations are implausibly large—for example, the administrator FTEs reported in Springfield in 2002, 2003, and 2004 are 93, 43, and 89.5, respectively. There are many similar examples. We could not identify indicators or patterns in the data that would allow us to identify errors in 2003 with confidence, so we elected to smooth the 2003 data for all Missouri districts. We smooth the 2003 data by linearly interpolating the 2002 and 2004 values.22
To identify less-common outliers in other years, which could also be errors, we began by calculating a local average value for each variable in each district and in each year. We defined the local average as the average of the four nearest values—for example, for a year-t value in district j, the local average is equal to the average of the t-2, t-1, t+1, and t+2 values in district j. We then calculated the absolute percent deviation of each year-t, district-j value as the difference between it and the four-year local average, in absolute value and as a percentage of the average. For example, a value of 100 for the absolute percent deviation for district j in year t indicates the value for that variable is twice as large as the average of the four nearby years.
We used the absolute percent deviation to identify likely errors. When reviewing the data, it quickly became apparent that smaller districts have generally larger values. Therefore, we selected size cutoffs separately for each variable as shown in Table A1 and used each district’s average size over the full data panel to assign it to a category, or “bin.”
Table A1
Size Bins for School Districts
| Administrator FTE | Teacher FTE | Total K–12 Enrollment | |
|---|---|---|---|
| Bin 1 | X < 1 | X < 5 | X < 100 |
| Bin 2 | 1 ≤ X < 5 | 5 ≤ X < 10 | 100 ≤ X < 250 |
| Bin 3 | 5 ≤ X < 10 | 10 ≤ X < 25 | 250 ≤ X < 1,000 |
| Bin 4 | 10 ≤ X < 25 | 25 ≤ X < 50 | 1,000 ≤ X < 2,500 |
| Bin 5 | 25 ≤ X < 50 | 50 ≤ X < 100 | 2,500 ≤ X < 5,000 |
| Bin 6 | 50 ≤ X < 100 | 100 ≤ X < 250 | 5,000 ≤ X < 10,000 |
| Bin 7 | X ≥ 100 | X ≥ 250 | X ≥ 10,000 |
Source: Authors’ calculations
Lower-numbered bins are for small districts, and higher-numbered bins are for larger districts. Table A1 describes 21 bins of data; seven bins constructed for each of the three variables.
After grouping districts into their bins, we flagged as likely data errors the top 0.5 percent in each bin in terms of the absolute percent deviation. Our objective was to remove obvious errors from the data (such as Hazelwood’s admin FTE in 2014, which went from 75.3 in 2013 to 17.25 in 2014 to 73.75 in 2015), but otherwise preserve the data as provided by DESE.
Figure A1 provides a visual example for district administrators at districts with 10 to 24 FTE (i.e., bin 4). As anticipated, the distribution of deviations is concentrated close to zero, which predictably indicates most districts have stable levels of administrator FTEs from year to year. At high levels of the absolute percent deviation, there are fewer and fewer observations. The distribution breaks visually when the absolute percent deviation gets to the high 30s, then breaks again more conclusively at 60. The 0.5th percentile is at an absolute deviation of 34.6 percent in this example.
Similarly to how we handle missing data and the errors in 2003, for the likely erroneous values flagged by our procedure, we overwrite them by linearly interpolating the values in the two nearest years. If the FTE for administrators or teachers is flagged for correction, we linearly interpolate total salary and average salary for that group as well.23
Note that overall, and outside of 2003, we correct only a small percentage of the district-year observations using this procedure. We have also explored the sensitivity of our findings to making adjustments to it—namely, by setting more aggressive thresholds for error corrections—and confirm our findings are not sensitive to reasonable adjustments. We show results from one such sensitivity test below, where we adjust our approach by linearly interpolating the top two percent of absolute percent deviations instead of the top 0.5 percent. The results are shown in Appendix Figures A2 and A3.
Figure A2
Our estimates of changes in teacher and administrator FTE and student enrollment are substantively unaffected if we use a more aggressive data-cleaning procedure than our preferred approach (as described in this appendix). Trends are normalized to the year 2000.
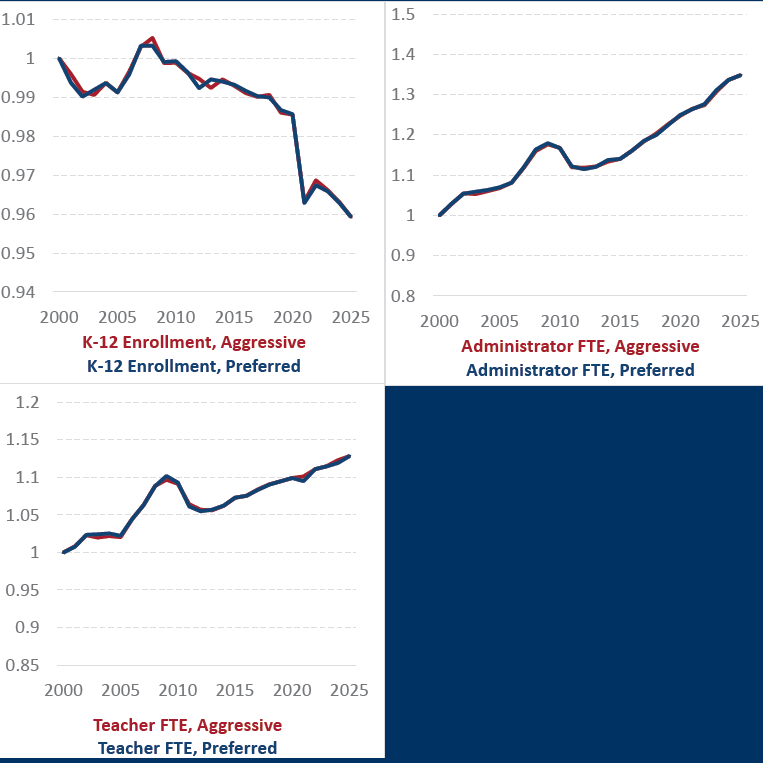
Source: Authors' calculations, Department of Elementary and Secondary Education (DESE) data.
Figure A3
Our estimates of changes in inflation-adjusted teacher and administrator average salaries and total salaries are substantively unaffected if we use a more aggressive data-cleaning procedure than our preferred approach (as described in this appendix). Trends are normalized to the year 2000.
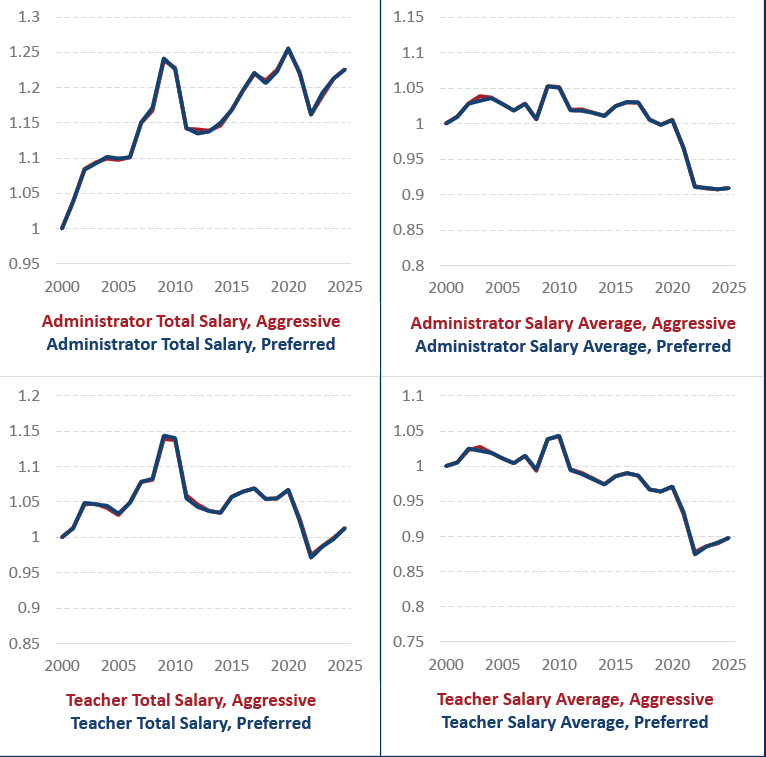
Source: Authors' calculations, Department of Elementary and Secondary Education (DESE) data.
Appendix B: Counterfactual Teacher Salary Calculation Details
In this appendix we provide details for our counterfactual teacher salary calculations under the different scenarios presented in the main text:
Scenario 1: We unwind the Personnel Boom for teachers only by returning teacher FTEs to the year-2000 level; Administrator FTEs are unchanged:

This is presented differently than in the main text, but the calculations are mathematically equivalent.
Scenario 2: We unwind the Personnel Boom for administrators only, by returning administrator FTE to the year-2000 level; Teacher FTEs are unchanged:
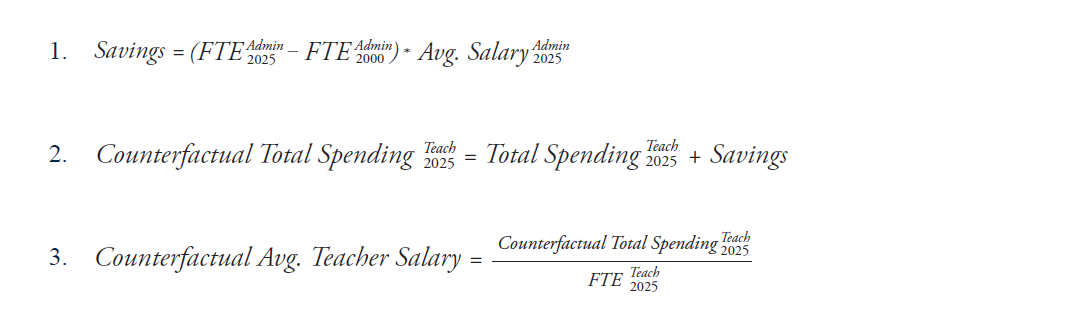
Scenario 3: We unwind the Personnel Boom for both teachers and administrators by returning their FTEs to the year-2000 levels.


Notes
- In constant 2025 dollars, per-pupil spending increased from approximately $14,600 in 2000–01 to just over $16,600 by 2020–21 (includes adult education spending and enrollment). Source: National Center for Education Statistics (NCES), Common Core of Data (CCD). ↩
- Hanushek, E.A., and Rivkin, S.G. 1996. Understanding the 20th century growth in U.S. school spending. National Bureau of Economic Research Working Paper No. 5547. ↩
- Our work follows closely on earlier work conducted by Scafidi, who tracks trends over time in spending on school personnel on a national scale. Scafidi, B. 2012. The school staffing surge: Decades of employment growth in America’s public schools. Policy Report. The Friedman Foundation for Educational Choice; Scafidi, B. 2013. The school staffing surge: Decades of employment growth in America’s public schools—Part II. Policy Report. The Friedman Foundation for Educational Choice. ↩
- FTE is a workload-adjusted measure of staffing. To illustrate, consider a district that hires one teacher to staff the 5th-grade art classroom in one semester, then another for the next semester. Since each individual worked only half of a full-time contract (for the one art position) each individual would count as 0.5 teacher FTE, and together they would add up to 1 FTE for the district. ↩
- Frank, Avery. Missouri sparks a brighter future for students, parents, and teachers, Show-Me Institute, 23 Apr. 2024, showmeinstitute.org/article/education/missouri-sparks-a-brighter-future-for-students-parents-and-teachers. ↩
- Become Certified Administrator, Missouri Department of Elementary and Secondary Education, dese.mo.gov/educator-quality/certification/become-certified-administrator. Accessed February 19, 2026. ↩
- We ran regressions using the data from 2007 onward of total teacher and administrator FTE for all Missouri districts and charter schools. Our regressions control for each district or charter school’s urbanicity category, total student enrollment and enrollment squared, and their shares of disabled and high-poverty students (based on the shares of students with individualized education plans and those enrolled in free and reduced-price lunch programs). Conditional on these controls, we estimate negative charter school coefficients in the teacher and administrator FTE models, which indicates that charter schools have lower FTE than traditional public schools, all else equal. The regression results are omitted for brevity but available from the authors upon request. ↩
- The description of data is from the Federal Reserve Bank of St. Louis Economic Data tool, retrieved 11.14.2025 at https://fred.stlouisfed.org/series/PPAAMO29000A156NCEN. ↩
- 2025 Missouri Poverty Report, Missouri Community Action Network, 15 Sept. 2025, missouripovertyreport.org. ↩
- WISQARS Web-based Injury Statistics Query and Reporting System: CDC, https://wisqars.cdc.gov/explore. Accessed May 26, 2026. ↩
- Missouri Department of Mental Health Student Survey: 2024, 2022, 2020, 2018, 2016, 2014, 2012, 2010, 2008, 2006, 2004, 2002, 2000. https://dmh.mo.gov/behavioral-health/missouri-student-survey. Accessed May 26, 2026. ↩
- Haidt, J. 2024. The Anxious Generation. New York, NY: Penguin Press. ↩
- There is also evidence of a sharp rise in misbehavior with the onset of the COVID pandemic, and no corresponding spike in teacher or administrator FTE, though this example is less compelling because the pandemic period was generally chaotic. See Baker, S.P., and Koedel, C,. forthcoming. The decline in teacher working conditions during and after the COVID pandemic. Journal of Research on Educational Effectiveness. ↩
- Ecclestone K. 2017. Changing the subject of education? A critical evaluation of “vulnerability creep” and its implications. Social Policy and Society 16(3):443–456; Haslam, N. 2016. Concept creep: Psychology’s expanding concepts of harm and pathology. Psychological Inquiry: An International Journal for the Advancement of Psychological Theory 27(1), 1–17. ↩
- Perry, K.H., and Ockerman, M.S. 2025. ABCs of Social Emotional Learning for School Counselors and Administrators. Thousand Oaks, CA: Corwin Press; United States Department of Agriculture. 2021. National School Lunch Program Fact Sheet. Retrieved November 24, 2025 at: https://www.fns.usda.gov/fns-101-nslp; Tate, A.S. 2018. Schools find one simple answer to attendance problem: washing machines. Today Show. Article retrieved November 13, 2025 at: https://www.today.com/parents/schools-find-one-simple-answer-attendance-problem-washing-machines-t101318. ↩
- The New Teacher Project. 2025. Teachers’ time use: A review of the literature. Policy Report. ↩
- Hess, F. 2017. Educators’ time loss and the invisible cost of reform. Education Next Blog 09.10.2017, retrieved on November 14, 2025 at: https://www.educationnext.org/educators-time-loss-invisible-cost-reform. ↩
- Scafidi, B. 2012. The school staffing surge: Decades of employment growth in America’s public schools. Policy Report. The Friedman Foundation for Educational Choice; Scafidi, B. 2013. The School staffing surge: Decades of employment growth in America’s public schools—Part II. Policy Report. The Friedman Foundation for Educational Choice. ↩
- Burle, Ashley Donaldson. The interconnectedness of Missouri’s teacher pipeline woes. SLU/Yougov, www.slu.edu/research/research-institute/big-ideas/slu-poll/data-archive/august-2023-poll/write-ups/slu-poll-analysis-education-issues.php. Accessed February 19, 2026. ↩
- We could also perform calculations that hold the teacher-to-student and administrator-to-student ratios fixed at their year-2000 levels. This would be an even more stringent way to unwind the Personnel Boom given Missouri’s declining student enrollment since the turn of the 21st century. We do not provide these calculations, but they show even larger potential increases in teacher salaries. ↩
- Scafidi, B. 2012. The school staffing surge: Decades of employment growth in America’s public schools. Policy Report. The Friedman Foundation for Educational Choice; Scafidi, B. 2013. The School staffing surge: Decades of employment growth in America’s public schools—Part II. Policy Report. The Friedman Foundation for Educational Choice. ↩
- For completeness, we use this procedure even if the 2003 data do not look abnormal for a particular district, though as a practical matter this aspect of our process is unimportant because, for these districts, the linear interpolation is close to the reported value. ↩
- Some other small details of our procedure merit brief mention. First, we could not identify likely errors in the first or last year of a district’s observations because there are insufficient data on both sides of the value to use our approach. Second, if a district-year observation has a very small local average—for example, less than two administrative FTE—we did not flag any values as errors because at such small values, large percentage fluctuations are common and could reflect real conditions. Third, charter operators have much larger fluctuations than traditional districts, and we ultimately decided not to modify any charter school values. We did manually review the charter operator data, but we could not conclusively identify errors and elected to be conservative in our corrections. Finally, we manually reviewed all of the flagged values using our procedure and determined a handful were due to real changes, in which case we overrode the correction. As a specific example, Normandy’s 2014 value was flagged as an error, but it is plausibly the result of the introduction of the Normandy Schools Collaborative in 2015, so we did not correct it. ↩