Over the years, I’ve talked a lot about the importance of transparency because transparency can often be an effective tool against government overreach. Generally speaking, the more the public knows about its government, the less likely that government will behave in ways contrary to the public interest. Transparency not only makes it easier to uncover past failures but also to head off future mistakes. As has been said, sunlight is the best disinfectant.
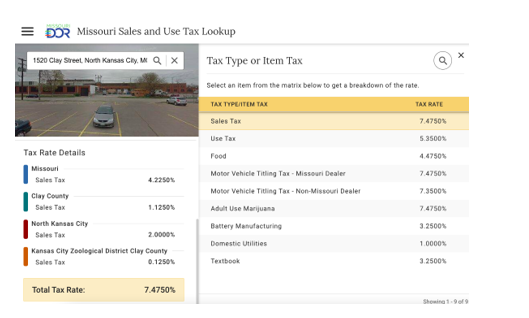
That’s why the latest version of Missouri Department of Revenue’s sales and use tax mapping tool is so welcome. A story by the eMissourian is a testament to precisely how I would hope the site would be used by the media and the public:
A purchase in downtown Washington comes with an 8.85 percent sales tax, which includes a 2 percent city sales tax and a 0.375 percent tax for the Washington Area Ambulance District.
Someone making the same purchase in downtown Union would have to pay 9.475 percent in sales tax. While Union has the same 2 percent city sales tax as Washington, consumers also pay a 0.5 ambulance district tax and a 0.5 percent tax for the Union Fire Protection District. St. Clair has the same 9.475 percent sales tax rate, with its fire and ambulance districts both having half cent sales taxes.
While Pacific charges a higher 2.5 percent city sales tax, it has the same overall 9.475 percent sales tax rate because no fire sales tax is shown.
You can find the sales and use taxes in your jurisdiction, and any Missouri jurisdiction, here.
It’s worth noting that while a number of articles this month have referenced the map as “new,” as my colleague Elias Tsapelas might note, it’d be more accurate to characterize it as “improved.” House Bill 1858 in 2018 and Senate Bill 153 in 2021 both helped lead to the new initiative, and perhaps serendipitously those local rate transparency initiatives also coincided with both the Show-Me Checkbook spending transparency projects and parallel spending transparency initiatives by the state treasurer and the state office of administration.
In other words, the transparency initiatives of the late 2010s are starting to bear fruit here in the early 2020s, so while some features on the interactive map may be “new,” the ideas aren’t. Of course, the state can always do more to promote transparency, such as requiring spending transparency from local governments and curricular transparency from schools and districts. But for what this tax map narrowly seeks to do, it does a good job of it.


