The Downtown Council’s Fuzzy Math
On Friday, Kansas City’s Downtown Council hosted its annual luncheon, titled “Downtown K.C. Smart City? Or The Smartest City?” If that makes you think the Council is more interested in boosterism than sound analysis, its “State of Downtown” report won’t make you feel any better. The whole report appears to hinge on creative interpretation and presentation of data.
For starters, the report refers to “greater downtown” Kansas City, which extends as far south as 33rd Street and includes the campus of Penn Valley Community College, two miles away from the Sprint Center. That may be a defensible standard, but I’m guessing it doesn’t fit with most Kansas Citians’ understanding. The photo above is of the KC skyline from a point within the area considered “greater downtown.”
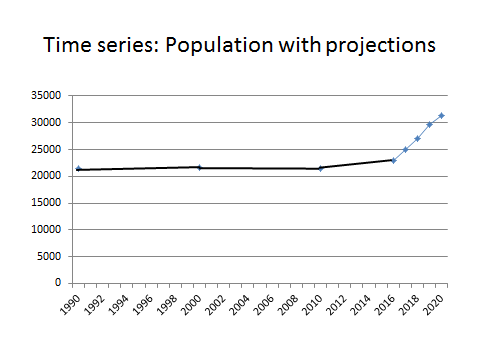
The Downtown Council also released a chart of downtown population growth with projections for future growth, and the outlook is decidedly positive. But if you examine the x axis, you’ll see that 1990 is as far from 2000 as 2019 is from 2020. This scale makes for a misleading presentation of the data.
We took the exact same data points and spaced them more evenly on a time series chart. What you see is largely flat growth from 1990 through 2016. Then the population projection lines rocket upward. The report concedes that this is “unprecedented growth,” but does little to explain exactly why the next few years will be so radically different than the past few decades.

Is it credible that between 2010 and 2020, “greater downtown” Kansas City will see a 46% population growth? For some context, researchers at the University of Virginia project that Kansas and Missouri are only supposed to see a population growth of 4 percent and 3 percent, respectively, in the same time period.
The Downtown Council offers questionable analysis when it discusses which generations choose to live downtown. The text of the report states:
At 41%, Greater Downtown Kansas City has the highest percent of millennials in our community. As you move farther away from downtown, the percentage drops to 26% for Kansas City, MO and 22% for the regional MSA.
The report goes on to tell us:
The data demonstrates that the living, location, and employment patterns of millennials is generally consistent across the country. They are choosing downtown for all their needs.
The report seems to say that because 41 percent of greater downtown residents are millennials that 41percent of millennials live in the greater downtown area. In fact, millennials are not “choosing downtown for all their needs.” Looking at the same 2016 ACS Census data and breaking it down by age group instead of by region, we learn that there are 548,588 millennials (aged 15 to 34) in the Kansas City MO-KS regional MSA. Just over 140,000 live in the city of Kansas City, MO, and according to the Downtown Council, 9,388 live in the “greater downtown.” This means that 74 percent of millennials reside in the region outside Kansas City, MO; 24 percent live inside Kansas City, MO but outside the greater downtown area; and 2 percent live downtown. In other words, downtown may have a large percentage of millennials, but among millennials themselves, only a tiny fraction live downtown.
Everyone wants Kansas City to do well, and promoting a city requires sound policy that rests on solid research. The “State of Downtown” report seems to provide neither. In fact, by presenting population projections wildly at odds with both recent history and state trends, and by overlooking where millennials chose to live, this report appears to deliver little more than mere boosterism.

