(You can read part one, part two, part three, part four, and part five in this series here.)
As earlier posts in this series have explained, defining an affordable housing problem is complicated. So too, is solving one. Because the issue is so complex, the definitions and data used to characterize the issue are incredibly important. Over the next two posts, I’ll walk through an analysis that sheds light on the affordable housing situation in Kansas City, which can then serve as a jumping-off point for a discussion of potential solutions for the region.
Even though the U.S. Department of Housing and Urban Development (HUD) defines “affordable housing” as a household spending no more than 30% of their income on housing, it is important to distinguish between situations where households exceed that threshold out of necessity because of a lack of sufficient options versus situations where they actively choose to spend more than 30% of their income on housing even when more affordable and still viable options are available.
Every household is free to choose where they want to live and pay what they feel they can afford to pay regardless of whether the government would view their choice as “affordable.” Conversely, there is nothing wrong with choosing to spend as little on housing as possible. The point is that while an aggregate story tells a tale, the personal stories of individual Kansas Citians shouldn’t be lost in our discussion.
For these reasons, this post focuses on estimating the potential demand for affordable housing–namely, the number of units needed at different cost points to accommodate Kansas City households if they were to spend no more than 30% of their income on housing. This analysis is primarily about households making less than the area’s median income (AMI), as the term is defined and published by HUD. In Kansas City, the AMI for a family of three is $78,000 per year.
To determine the potential demand for affordable housing, we need an estimate for the number of households in different income ranges, and then we can multiply each income range by 30% and divide by 12 to arrive at the monthly housing cost range that would be affordable to those households. The definition of income we use comes from the U.S. Census Bureau’s American Community Survey (ACS) and encompasses labor market earnings, self-employment income, interest and dividends, retirement income, and “any public assistance or welfare payments from the state or local welfare office” but not other sources of government assistance such as Medicaid.
In principle, one could consider augmenting this measure to include non-cash benefits like Medicare for retirees, Medicaid, employer-provided health insurance and other such fringe benefits in the income measure for purposes of calculating the 30% affordability thresholds. But obtaining data on each of these items is quite difficult, and deviating from the widely used ACS definition would entail making judgment calls about the cash value that households attach to them.
For example, if a household receives $20,000 of income a year according to the ACS income definition, the 30% of income affordability threshold for the household would be $500 (= $20,000 x 30% x 1/12) in rent or mortgage payments. If the household also receives Medicaid benefits that cost the government $6,000 to provide—and if the household would have otherwise chosen to spend that same $6,000 itself absent Medicaid—then the household’s income effectively rises to $26,000, and one could argue that the affordability threshold should increase to $650 (= $26,000 x 30% x 1/12). However, if the household would not have spent a full $6,000 to obtain alternative health insurance in the absence of Medicaid, the cash equivalent value is less, and the affordability threshold would be between $500 and $650. Thus, you cannot assume that various government benefits are the equivalent of income.
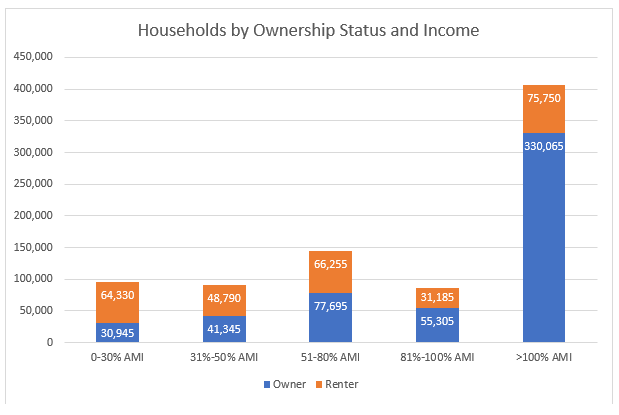
You can see in the table below based on data from the ACS and compiled by HUD that there are approximately 820,000 households in the Kansas City metropolitan area. Additionally, the majority of those making less than the AMI are renters (which should make some intuitive sense).

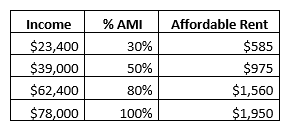
The table below gives an idea of how much a family of three with various incomes below the AMI can pay for housing that is considered affordable using the 30% rule of thumb from HUD.

Taken together, we have an idea of how much housing could be needed in Kansas City, and at what price points. The next question is how those figures compare to the reported supply of housing in Kansas City, which will be the topic of the next post.


