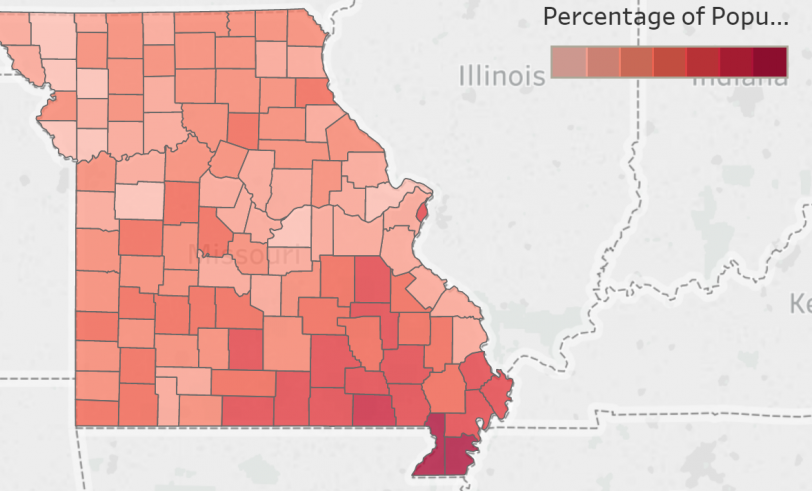
Map: Medicaid Spending and Enrollment by County in 2016

Recently, Patrick Ishmael, Show-Me’s Director of Government Accountability, pointed out that Medicaid spending is increasing in Missouri at an alarming rate. Even though some downplayed the 6.2 percent growth in spending, there is cause for concern. The Medicaid budget increased by nearly $570 million from FY2016 to FY2017. Additionally, Ishmael notes that Medicaid’s share of the budget has risen from 18.4 percent in FY2000 to over 37 percent in FY2016.
Since Medicaid is such a large part of state spending, it is worth taking a closer look at where and how this money is being spent. Below is a map that shows the percentage of counties’ populations enrolled in Medicaid, also known at Mo HealthNet. The data table, provided by the Department of Social Services, can also be sorted by expenditures, enrollees, and percentage of the population for each county.
The data displayed are from FY2016; in FY2017, another $570 million and 26,948 enrollees were added to these numbers. This information could help provide a clearer picture of Medicaid’s costs and the variation in participation rates across counties. With such information, lawmakers and taxpayers can better understand how changes—whether cuts or expansion—to the program would affect the state.

