Missouri’s teacher shortage has become a fixture of state political debate, and lawmakers have already raised the minimum teacher salary and created new pay flexibility in response. But a close look at the state’s own staffing and teacher-pipeline data tells a narrower story: statewide, Missouri has been adding teachers even as enrollment falls. The real pressure is concentrated in a handful of hard-to-staff subjects, like physics and special education, and a handful of high-poverty districts in St. Louis and Kansas City, which means the broad, statewide fixes lawmakers have reached for may not be aimed at the actual problem.
Table of Contents
Key Takeaways
- Missouri’s teacher shortage receives substantial media attention and is often framed as a statewide crisis.
- A closer examination of Missouri’s teacher pipeline and hiring patterns does not point to a broad, statewide shortage of teachers; rather, shortages appear to be concentrated in specific subject areas and specific high-need, challenged school districts.
- Policymakers could help address specific shortages by:
- Attracting excellent teachers to school districts with severe shortages through targeted pay incentives.
- Making it easier for qualified professionals to switch careers and become teachers.
- Improving data collection so policymakers can accurately identify shortages and propose targeted solutions.
Executive Summary
Missouri’s teacher shortage has received substantial media coverage in recent years. In 2024, Paul Katnik, an assistant commissioner for the Missouri Department of Elementary and Secondary Education (DESE), described the teacher shortage as follows: “It’s the worst right now than it’s ever been, so I don’t know a better reason to get urgent about something.”1
Urgent action was taken; the massive omnibus education bill, Senate Bill 727, included several provisions to improve teacher compensation. These included an increase to the state’s mandated minimum teacher salary, from $25,000 to $40,000, the reinstatement of a “career ladder” program designed to provide additional compensation for teachers, the allowance of teacher pay differentiation, and other measures.2 And it didn’t stop there. In 2025, Senate Bill 68 included a provision that allows teachers with master’s degrees to qualify for a special increase even if their degree is not directly related to their current teaching position.3
Yet even after these actions, complaints of a broad, statewide teacher shortage continue. This raises two central questions: Does Missouri have a teacher shortage? And if so, what types of policies would help address it?
To answer these questions, we consider the context of Missouri’s teacher pipeline and labor market. The data in this report suggest that the shortage is narrowly concentrated in specific subject areas and in specific types of school districts.
Understanding Missouri’s teacher pipeline is important for crafting effective policy. Shortages may force schools to use unqualified instructors or temporary substitutes and may even lead to the cancellation of classes in hard-to-staff elective areas like physics. Yet in response to what is often a geographically limited or subject-specific problem, sweeping measures are often proposed as the solution. Raising the base teacher salary might help attract more teachers to a low-paying school district, but it will not help high-poverty urban school districts that already pay above the new minimum salary. The state has been pushing broad and expensive solutions for problems that may instead call for narrow, tailored responses.
This report examines the teacher pipeline and hiring patterns in order to inform more precise policy strategies going forward. The following five findings summarize the major trends:
- As K–12 enrollment has declined in Missouri, the number of public school teachers and support staff has increased.
- Enrollment in teacher-preparation programs dropped between 2015 and 2018 but has since rebounded. This reversal may lead to an increase in program completers in the coming years, because completion lags enrollment.
- St. Louis and Kansas City teacher-preparation programs have seen sharp declines in the number of program completers, which may exacerbate shortage problems in these regions going forward.
- There are few teacher-preparation program completers in high-need subject areas like physics.
- Hiring challenges appear to be concentrated in specific subject-areas and school districts.
With these trends in mind, Missouri should first improve data reporting practices in order to better identify true shortages. For shortages in high-need schools specifically, one option could be a form of “crisis pay” for excellent teachers (identified through a teacher evaluation system like the Tennessee Department of Education’s TEAM evaluation model) willing to teach at schools with severe shortages. Local solutions that could help improve classroom conditions outside of pay incentives include strict cell phone ban policies and teacher and administrator unity on disciplinary policies.
In addition, Missouri should help open up the teacher pipeline by easing the pathway for qualified and capable career switchers to become teachers through streamlined certification processes and more flexible salary structures. This could be particularly useful in filling high-need subject areas such as physics.
Literature Review and Defining “Teacher Shortage”
Before beginning an analysis of Missouri data, it is important to understand some of the terminology in this field and the existing research literature. One challenge faced by researchers is establishing a clear definition of what constitutes a “teacher shortage.”
In one view, a teaching position is defined as part of a shortage if it is left vacant, is filled by a teacher with a temporary or emergency credential, is staffed by a teacher who is solely responsible for the classroom while currently completing student teaching in an alternative certification program, or is taught by a teacher who is not credentialed in that subject area.
DESE’s definition aligns with this view, as it defines shortage areas as those in which “positions were filled with inappropriately certified teacher(s) or left vacant due to the absence of certified candidates.”4
By this definition, any teaching position filled by an underprepared teacher rather than a fully certified teacher would be considered part of a shortage rather than being related to quality of fit or competency. For example, if a district hires a former astrophysicist to teach physics, but this person did not graduate from a college of education, this teaching position could be counted as part of a shortage. And if a teacher with a teaching certificate in high school math decided to take a middle school math job in her hometown, she would also be counted as part of the teacher shortage because she is not credentialed specifically for that grade level (note, however, that for some subjects, having certification at a different grade level would still count as being appropriately certified; examples include agriculture, drama, and world languages).5
Though such a broad definition of a “shortage” is quite common, it can overstate a shortage.6,7 Other researchers, such as Dan Goldhaber and Trevor Gratz from the University of Washington, measure the teacher shortage by vacancy rate in each subject area.8
While vacancy rates more cleanly identify positions that remain unfilled, focusing exclusively on them may obscure shortages in core academic subjects. Districts often rely on teachers with emergency or out-of-field credentials to staff required courses, meaning vacancies alone may understate staffing challenges in subjects such as mathematics or English. This dynamic can distort comparisons between elective subjects such as physics and core subjects, where districts face stronger pressure to fill classrooms regardless of certification alignment.
In this paper, we primarily rely on the vacancy-rate approach, while acknowledging the strengths and limitations of both definitions. Accordingly, later sections report both vacancy rates and rates of inappropriately certified teachers.
Beyond definitions, there are also differing views on the nature of these shortages, with two main viewpoints describing teacher shortages as:
- A broad issue, largely due to low across-the-board salaries and the stressful nature of the career.
- A narrow issue, largely due to subject-specific or school-specific deficiencies in the pipeline.
According to the broad view, teacher shortages are a systemic problem affecting the profession, with underlying causes such as low base salaries and increasingly difficult teaching environments (underprepared students, violent students, lack of aides, etc.) that lead to increased attrition rates.9 Proponents of this view argue that high-poverty schools disproportionately suffer from more difficult teaching environments and lower salaries, and thus these schools are hit harder by teacher shortages. Accordingly, to alleviate shortages we must raise teacher salaries across the board, enact even higher increases in high-poverty schools, and provide teachers with student debt relief and opportunities to earn additional pay. Proponents of the broad view also recommend prioritizing mental health by increasing “professional respect” and helping teachers navigate the challenges of instructing unprepared and violent students. This is the view put forth by many educator groups in Missouri.10
According to the narrow view, meanwhile, teacher shortages are specific to geographic areas or academic subjects. For instance, researchers in the state of Washington found that shortages there were not widespread but were instead concentrated in high-poverty schools.11
In the narrow view of shortages, it is not just location and district characteristics, but also the availability of teachers with specific qualifications that determine the extent of the problem. While physics teachers and elementary teachers with similar experience and credentials may be paid the same, the pathway, qualifications, and market demand for those jobs differ.12
Special education, for example, is a field that requires specific training and a special disposition on the part of the teacher. For these reasons, it is an area that often experiences shortages. A 2021 study of special education found a 6.8 percent increase in vacancies for special education teachers since 2012.13 The study contrasts high-shortage states with low-shortage states, and its results suggest that a key difference between the two was pay differential for special education teachers. States that paid special education teachers more relative to other teachers tended to have lower rates of shortages. When a state draws from a general pool of interested educators, lack of pay differentiation makes it more difficult to fill certain positions, such as special education. Therefore, when considering solutions, an across-the-board pay raise for teachers is likely to be less effective and far less efficient than a targeted approach.
In another rigorous analysis of data from the state of Washington, researchers counted job postings to determine vacancy rates.14 They found the highest shortage rates in hard-to-staff areas, such as English language learning; special education; and science, technology, engineering, and math (STEM) areas. They found no shortage for elementary teachers. The authors therefore argue that across-the-board salary increases would not be efficient, and that pay differentiation is a better way to recruit and retain teachers in hard-to-staff areas—a strategy now permitted in Missouri under 2024’s education omnibus Senate Bill 727.15
Our view is more in line with that of the latter authors. Missouri has an acute problem primarily in specific schools and subject areas. When policymakers attempt broad solutions, they increase costs but fail to effectively address the underlying problems. In the next section, we analyze Missouri’s teacher pipeline and labor market to understand the nature of our state’s teacher shortage.
Missouri’s Teacher Pipeline
Traditionally, becoming a teacher has required graduating from a teaching program at a college or university, making Missouri’s teacher preparation programs vital in developing students into educators. This section of the report presents data related to enrollment in, and completion of, state teacher preparation programs. These data were obtained from DESE, the National Center for Education Statistics (NCES), and the Title II report required by the reauthorization of the Higher Education Act in 2008. The DESE data provide K–12 enrollment figures, the number of full-time-equivalent teachers, and student–teacher ratios. NCES provides additional staffing statistics. Title II provides information on enrollment in, and completion of, preparation programs.
All figures identify school years by the latter year (2012 represents the 2011–2012 school year).
Finding 1: While K–12 enrollment has declined, the number of public-school teachers and support staff has increased.
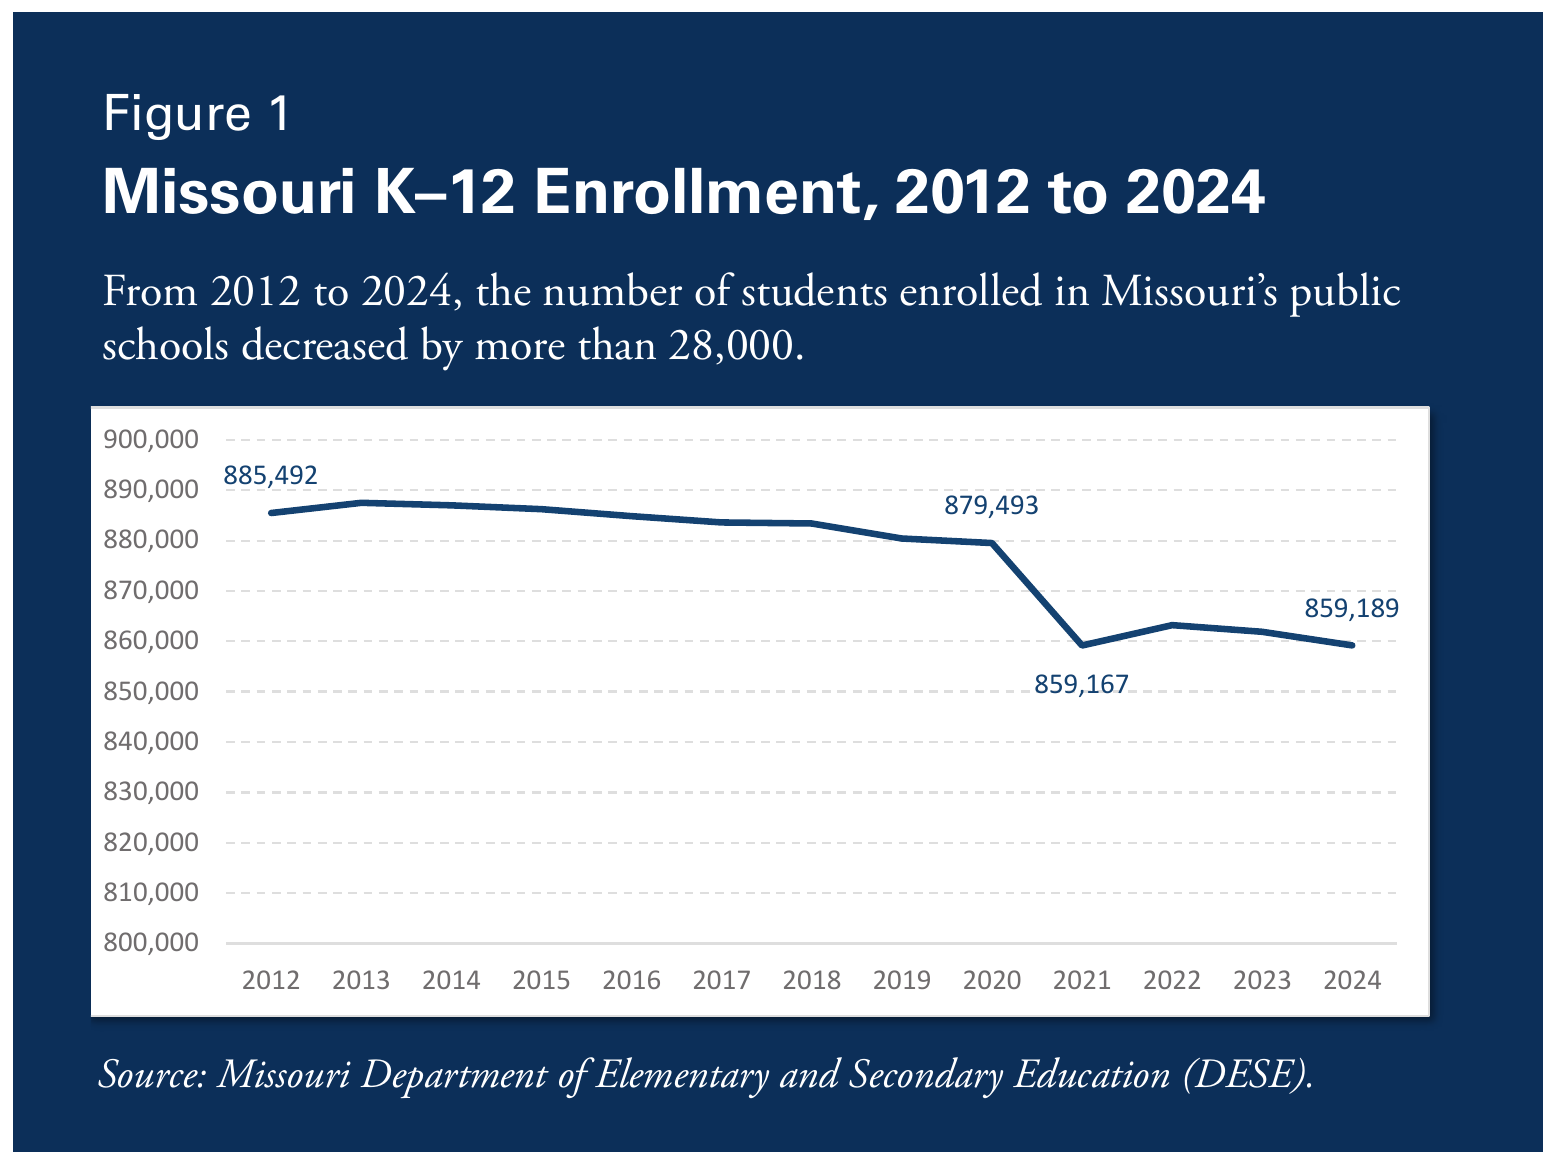
Over the past decade-plus, enrollment in Missouri’s public schools has steadily fallen, with a large drop and little recovery following the COVID-19 pandemic (Figure 1). The number of students has fallen from a high mark of 887,496 in 2012–13 to 859,189 in 2023–2024, a reduction of more than 28,000 students. For context, let’s assume an average class had 20 students. With this reduction, we might expect there to be approximately 1,400 fewer public school teachers in Missouri with the loss of 28,000 students (28,000 ÷ 20 = 1,400). However, Missouri’s public schools added over 4,000 teachers during this time (Figure 2).
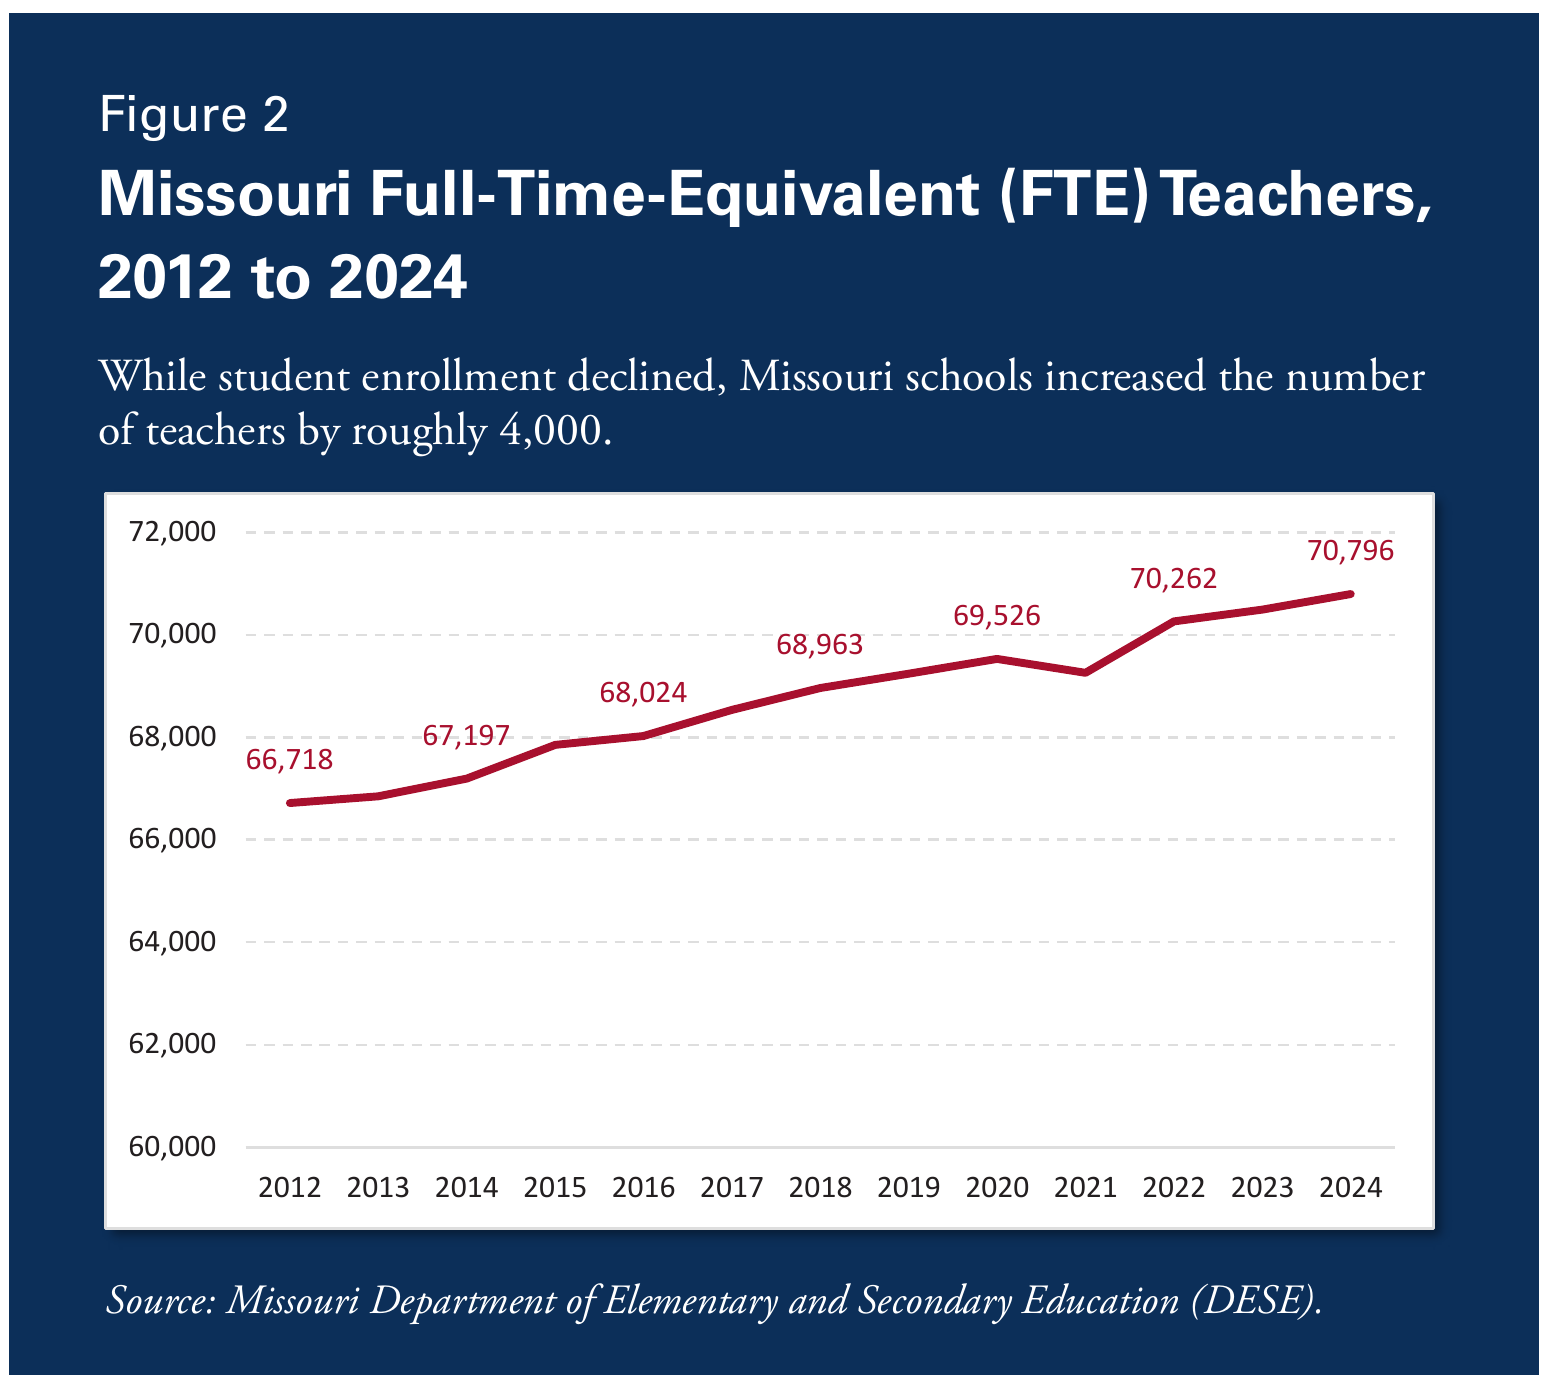
In 2011–12, Missouri’s student–teacher ratio was 13.3 students per teacher, but in 2023–24, it was 12.1 (far below the national average of 15 students per teacher).16 Policymakers may need to consider how low the student–teacher ratio should reasonably go.
It is also important to think about the tradeoffs related to the student–teacher ratio. State and federal funding are based in large part on the number of students in a given school district. Thus, when the number of students is declining, school districts typically do not receive more funding. That is, of course, apart from any increases in funding that might occur as a result of other changes, such as increases in overall state funding or increased property tax revenues. In any case, when school districts hire more teachers to serve fewer students, one result is downward pressure on teacher compensation.
Missouri school districts, as a whole, are hiring an increased number of teachers and staff to serve a shrinking student body. This pattern does not point to a broad, statewide shortage.
Finding 2: Enrollment in teacher-preparation programs dropped between 2015 and 2018 but has since rebounded. This may lead to an increase in program completers in the coming years because completion lags enrollment.
Another way to evaluate the teacher pipeline is to examine the number of teachers enrolling in and completing teacher-preparation programs. These programs are formal pathways that train individuals to become licensed educators. The traditional pathway to the classroom, through colleges of education, remains the largest supplier of teachers. However, Missouri has a substantial number of teachers entering via alternative programs.
Alternative certification programs are typically designed for individuals who have not obtained a bachelor’s degree in education. Missouri has alternative certification programs offered through institutes of higher education (IHEs) and alternative pathways unaffiliated with an IHE. Alternative IHE programs generally require a participant to be employed as a classroom teacher while enrolling in a program at a college or university. Non-IHE programs require a bachelor’s degree and the passage of content exams. In Missouri, alternative non-IHE programs include the American Board of Certification for Teacher Excellence (ABCTE), the St. Louis Teacher Residency Program, the Kansas City Teacher Residency Program, and Teachers for Tomorrow, with the latter accepted following the passage of Senate Bill 68 in the 2025 Missouri legislative session.17
The figures that follow show the number of individuals who have moved through these state preparation programs. The appendix contains a full list of the 44 Missouri providers that are included.
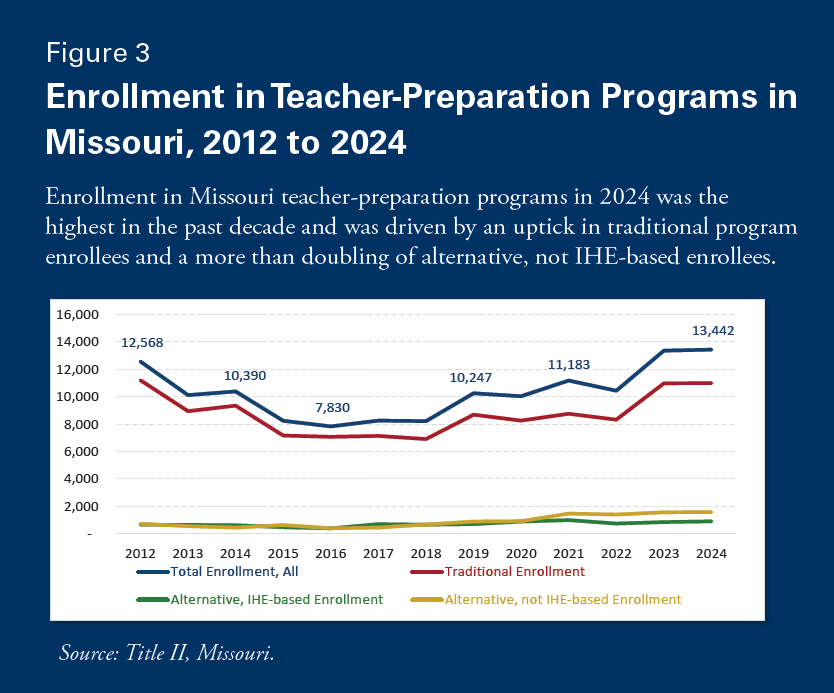
From 2011–12 to 2015–16, the number of students enrolled in traditional and alternative teacher-preparation programs dropped precipitously (Figure 3), from 12,568 in all programs to a low of 7,830. The number then held steady for a few years and began to tick back upward. By 2023–2024, the number enrolled in teacher-preparation programs was back to a 12-year high of 13,442 people. This trend is not unique to Missouri, but rather matches what has been seen across the country.
Although enrollment in teacher-preparation programs increased, the number of program completers declined (Figure 4). From 2011–12 to 2017–18, the number of total program completers in Missouri declined by roughly 1,300. Since then, the number has remained relatively flat. In theory, the number of program completers should lag program enrollment. However, we have not yet seen the recent increase in enrollment translate to increases in program completers.
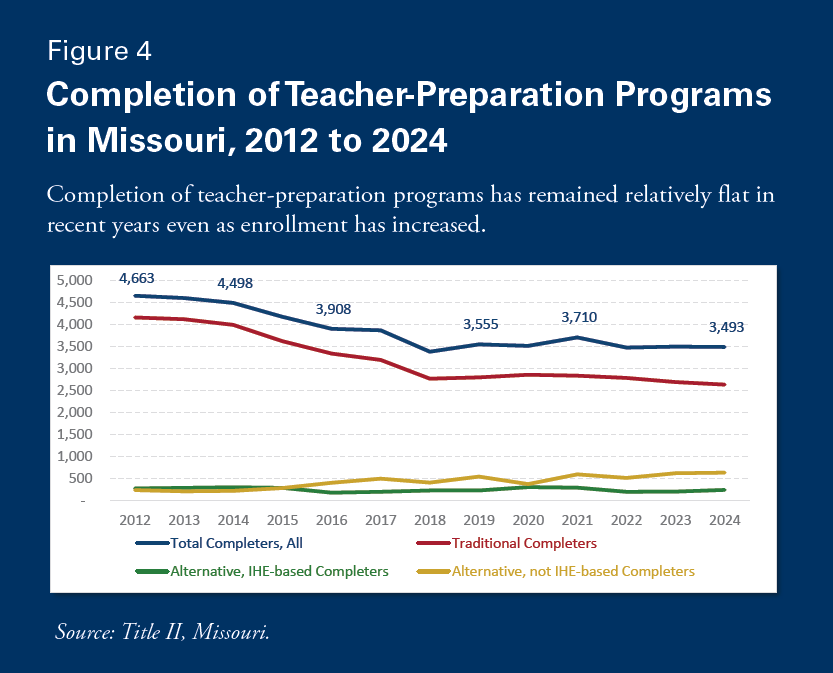
By contrast, the number of students who have completed certification programs outside of IHEs has almost tripled since 2012, largely because of strong growth in completion from the American Board for Certification of Teacher Excellence (ABCTE). In 2012, ABCTE had 80 completers. In 2023, it had 496 and was the largest producer of new teachers in Missouri. ABCTE is a self-paced, entirely virtual program for individuals who already hold a bachelor’s degree, and it requires no coursework. Prospective teachers receive materials and coaching to prepare for their subject-area and professional teaching (pedagogy) exams. In Missouri, an ABCTE applicant must also complete 60 verified hours as a substitute teacher or paraprofessional and, as of July 2026, pass a designated Praxis assessment (another teaching and subject-area test) to receive a Missouri teaching certificate. The program costs under $2,000 to complete.18
Because of its flexibility, speed, and low cost, ABCTE has become a vehicle for career-switchers entering the teaching profession for biology, chemistry, elementary education, English/language arts, general science, social science, mathematics, and physics. Research shows little difference in effectiveness between teachers entering through traditional and alternative certification routes.19
The growth of alternative program completion is encouraging. If traditional completion begins to align with enrollment trends, Missouri could see an influx of new teachers in classrooms across the state.
Finding 3: St. Louis and Kansas City teacher-preparation programs have seen sharp declines in the number of program completers, which may exacerbate shortage problems in these regions going forward.
If overall staffing trends are not pointing to a statewide issue, then where is the pressure coming from? To answer this, it is useful to look at which institutions are preparing new teachers.
Interestingly, far fewer teachers are being prepared in IHEs from the Kansas City and St. Louis areas. This matters because teachers typically teach close to home. As a result, falling output in the major metros may be increasing pressure on school districts in those regions.20
In 2022–23, just 253 individuals completed a teacher-preparation program in the Kansas City area (Figure 5)—which is a little over half the total from 2011–12. Rockhurst University in the Kansas City area dropped from 95 completers in 2011–12 to only 18 in 2022–23. The University of Missouri–Kansas City saw a similar decline, going from 170 to 57 completers.
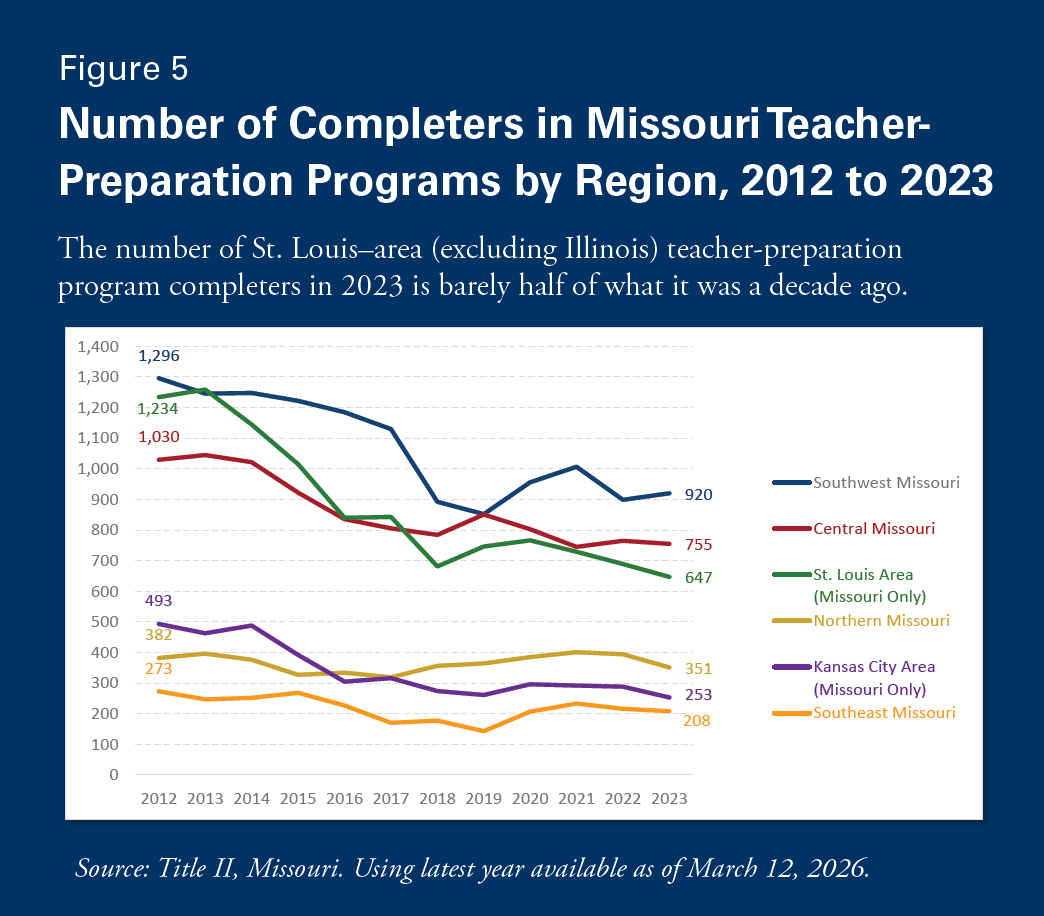
On the other side of the state, the number of individuals completing preparation programs in St. Louis dropped nearly 50 percent in a 10-year period. Numerous St. Louis institutions show marked declines; a few notable examples are listed below:
- University of Missouri–St. Louis: 410 → 197
- Lindenwood University: 282 → 110
- Missouri Baptist University: 185 → 64
- Fontbonne University: 130 → 38
Table A and Table B in the appendix display the regional classification of Missouri IHEs and the number of individuals who completed teacher-preparation programs.
These declines may be amplifying shortage pressures in these regions and contributing to the broader statewide narrative of a teacher shortage.
Finding 4: There are few teacher-preparation program completers in high-need subject areas like physics.
There are also subject-specific concerns. Title II data show that while Missouri institutions produce large numbers of elementary educators, they prepare far fewer candidates in hard-to-staff areas such as physics, chemistry, special education, and English as a second language.
Of course, output alone does not define a shortage. A school may need 12 elementary teachers but only one physics teacher. Still, the supply imbalance in hard-to-staff subjects is notable.
In 2022–23, Missouri teacher-preparation programs produced just eight new physics teachers. Other subject areas, such as chemistry and Spanish, show similarly low output from the pipeline.
Expanding access for career-switchers, such as former scientists becoming physics teachers, may help address these shortages.21 This could help mitigate the lack of output from the traditional pipeline.
Finding 5: Hiring challenges appear to be concentrated in specific subject areas and school districts.
The trends observed in the teacher pipeline mirror Missouri’s hiring patterns. Low output in physics, special education, and English as a second language corresponds to higher vacancy rates in those subjects.
Using DESE vacancy data from 2017–18 through 2021–22, we examined how districts filled FTE vacancies, looking specifically at whether positions were left unfilled or filled with inappropriately certified teachers. (Although we requested data through 2024–25, significant irregularities in reporting made newer data unreliable.)
There are a few limitations in the dataset that should be acknowledged. Some districts reported vacancies in certain subjects, but did not fully account for how those vacancies were filled. Observations that did not fully account for every reported vacancy were excluded from the analysis. These observations represented roughly 2% of the dataset. It also seems that districts did not consistently report their FTE vacancies to DESE every year. To cite three examples, Fox C-6 reported more than 40 vacancies each year in 2018, 2019, 2020, and 2022 but did not report data in 2021. Pattonville R-III did not report data in 2018, 2019, or 2022, but reported 52 vacancies in 2020 and 44 vacancies in 2021. Some districts, like Hancock Place, only reported vacancies in one year.
Despite the issues with the DESE data, we thought the best approach was to compare subject areas to themselves year over year and rank them by vacancy rate. Then, we took the average ranking over the five-year period. This approach assumes that any reporting errors were not systematically biased toward or against any specific subject area (the data are not heteroskedastic by subject). For example, if a district reported vacancies inconsistently, we did not assume that math vacancies were recorded less reliably than English vacancies. This assumption allows us to capture the overall five-year trend for subject areas with confidence.
To explain further, a subject could have the following relative rankings:
- 2nd-highest rate of positions left vacant in 2018
- 8th-highest rate of positions left vacant in 2019
- 10th-highest rate of positions left vacant in 2020
- 5th-highest rate of positions left vacant in 2021
- 3rd-highest rate of positions left vacant in 2022
This would lead to the subject having an average ranking of ((2 + 8 + 10 + 5 + 5)/5) = 6. This is done for each subject, and Figure 6 and Figure 7 list in order the top ten and bottom ten subject areas in average, relative ranking between 2017–18 and 2021–22. Adding positions filled with inappropriately certified teachers causes a modest reshuffling of rankings, but the results are similar. More detailed results can be found in Table C in the appendix.
Figure 6
Top and Bottom 10 Subject Areas Average Relative Ranking, Based on Yearly Percent of FTE Positions Left Vacant from 2018 to 2022
Aligning with the literature, subject areas like special education, English language learners, and STEM subjects were harder to fill than other subjects.
| Rank | Subject (avg. vacancy rate) | Rank | Subject (avg. vacancy rate) |
|---|---|---|---|
| Highest ↓ | Industrial Technology (8.4%) | 23rd | English (1.2%) |
| 2nd | Technology Education (7.5%) | 24th | Earth Science (1.2%) |
| 3rd | Deaf and Hard of Hearing (27.3%) | 25th | Language Arts (1.2%) |
| 4th | English Language Learners (6.4%) | 26th | Speech/Theatre (1.0%) |
| 5th | Early Childhood Special Ed (5.5%) | 27th | Physical Education (1.1%) |
| 6th | Spanish (4.5%) | 28th | Agriculture Education (1.0%) |
| 7th | Music – Vocal (4.0%) | 29th | World Languages (1.7%) |
| 8th | Physics (7.2%) | 30th | Elementary Education (0.8%) |
| 9th | Mathematics (2.9%) | 31st | Early Childhood Education (0.6%) |
| 10th | Biology (2.3%) | Lowest ↑ | Social Science (0.5%) |
Source: Missouri Department of Elementary and Secondary Education (DESE). Note: Average vacancy rate in parentheses.
Figure 7
Top 10 and Bottom 10 Subject Areas Average Relative Ranking, Based on Yearly Percent of Positions Left Vacant or Filled with an Inappropriately Certified Teacher from 2018 to 2022
Even when including FTE positions that were filled with “inappropriately certified teachers,” the subject areas seeing the greatest difficulties remain largely unchanged.
| Rank | Subject (avg. vacancy rate) | Rank | Subject (avg. vacancy rate) |
|---|---|---|---|
| Highest ↓ | Industrial Technology (22.0%) | 23rd | World Languages (6.7%) |
| 2nd | Business (17.5%) | 24th | Health (6.7%) |
| 3rd | Biology (16.3%) | 25th | Social Science (6.8%) |
| 4th | Technology Education (16.3%) | 26th | Speech/Theatre (5.7%) |
| 5th | Deaf and Hard of Hearing (30.8%) | 27th | Physical Education (6.4%) |
| 6th | Science (11.7%) | 28th | English (6.5%) |
| 7th | Early Childhood Special Ed (12.5%) | 29th | Music – Instrumental (6.2%) |
| 8th | English Language Learners (11.0%) | 30th | Special Reading (5.8%) |
| 9th | Physics (14.7%) | 31st | Early Childhood Education (4.5%) |
| 10th | Earth Science (10.4%) | Lowest ↑ | Elementary Education (3.6%) |
Source: Missouri Department of Elementary and Secondary Education (DESE). Note: Average vacancy rate in parentheses.
Missouri’s hiring patterns align with both the pipeline data and the narrow-view literature—shortages are concentrated in specific subject areas like special education, the sciences, and English as a second language.
We also examined how local education agencies (LEAs) in the St. Louis and Kansas City metro areas filled their FTE vacancies.
Across the two metro areas, there is a wide mix of districts. Yet, the districts facing the most persistent hiring challenges are those that are poorer and urban. It must be noted, however, that some districts, including the City of St. Louis, either did not report vacancy data or only reported it sparsely.
For the St. Louis region, 39 districts and charters reported more than 10 FTE vacant positions needing to be filled between 2017–18 and 2021–22. Of those, 25 had zero percent of their positions left vacant, and another seven had less than five percent. Most of the region appeared to face very low shortage pressure. However, there were four districts in St. Louis County that had notable rates of positions left vacant: Riverview Gardens, Normandy Schools Collaborative (Normandy), Jennings, and Hazelwood. Table D in the appendix displays the full results.
Hazelwood had one of the highest rates in the region, with 5.5 percent of its vacant positions remaining vacant. Jennings had over twice as high a rate, at 13.7 percent. Even worse, 29.5 percent and 35.6 percent of Normandy and Riverview Gardens FTE vacant positions remained vacant between 2017–18 and 2021–22.
Similar trends are observed in the Kansas City area, but at a lower magnitude. Table E in the appendix breaks down how vacancies were filled across districts. Of traditional public school districts, the percentage of positions left vacant in high-poverty Hickman Mills C-1 (25.6%) dwarfs that of others in the region. In fact, Kansas City 33 had the second-highest rate of 5.4 percent.
Direct certification is a proxy for student poverty. Any child belonging to a household that participates in Supplemental Nutrition Assistance Program (SNAP), Temporary Assistance for Needy Families (TANF), Food Distribution Program on Indian Reservations (FDPIR)—as well as children who are migrant, homeless, in foster care, or in Head Start—are categorically eligible to receive free meals at school and are directly certified.22
In 2020–21, of all traditional public schools in the state, Riverview Gardens (68%) and Jennings (66%) had the top two highest percentages of low-income students—identified by direct certification. Normandy (51%) and Hickman Mills C-1 (48%) were not far behind at 11th highest and 20th highest.23 The stark contrast in positions left vacant among LEAs in these regions reinforces the need for targeted solutions that support hard-to-staff districts and directly alleviate the specific shortage pressures they face.
Statewide teacher salary increases are unlikely to meaningfully change conditions in Riverview Gardens, Normandy, Jennings, and Hickman Mills where the average teacher salaries already stand at $56,976, $58,282, $70,783, and $66,681, respectively.24
These findings also raise questions about what kinds of teacher vacancies LEAs like Riverview Gardens and Hickman Mills are struggling to fill. In the appendix, Figures A and B display a full list of subject areas and their associated vacancy rates.
Even in the districts that face the greatest shortages in St. Louis and Kansas City, there were still differences between districts facing moderate difficulties (Hazelwood, Kansas City 33) and the highest-difficulty districts (Riverview Gardens, Normandy, Hickman Mills). The difference is most evident in the percentage of positions left vacant in elementary education, which saw rates of 0 percent and 2 percent in Hazelwood and Kansas City 33, 24 percent in Riverview Gardens and Normandy, and 12 percent in Hickman Mills. Elementary education is one of the easiest subjects to staff in Missouri, and shortage pressure in this subject may signify strong and unique shortage pressure for these districts. It is worth considering the need to bring uniquely tailored, targeted solutions to these three school districts (the City of St. Louis did not report shortage data and Jennings did not have sufficient subject-level data, but could be worth evaluating as well).
Lastly, we can also consider Missouri in the context of the United States. A 2024 national study from the American Educational Research Association analyzed the number of vacancies and underqualified hires per 10,000 students and per 100 teachers (the two measures saw similar results). In this study, which included 36 states, Missouri had the sixth-lowest vacancy rate per 10,000 students and the 16th-lowest underqualification rate per 10,000 students.25
Policy Implications
The teacher shortage has received and continues to receive media coverage, even after the plethora of policy solutions from Senate Bills 727 and 68. The issue, assuming these claims are earnest, is locating the pressure points. Are schools having difficulty getting any teacher to apply, or are schools just longing for one day to find a physics teacher? This differs based on the district.
But looking at the state and the St. Louis and Kansas City metro areas, Missouri’s teacher pipeline and hiring trends suggest a more nuanced shortfall rather than a broad crisis.
These trends suggest that broad solutions like across-the-board pay raises are unlikely to alleviate shortages where they occur. A more effective response would be to identify and target hard-to-staff schools and subject areas. The following section describes a number of potentially beneficial reforms.
Pay Differentiation
Considering our state’s pipeline and hiring trends, the goal should be to increase the recruitment and retention of teachers in high-shortage schools and hard-to-staff subject areas.
The allowance of pay differentiation in Senate Bill 727 was a step in the right direction. Mark Walker, the chairman of the Missouri State Board of Education’s Teacher Recruitment and Retention Blue Ribbon Commission, advocated for the policy change, stating:26
Pay differentiation was accompanied by the creation of a scholarship program for prospective teachers if they agree to teach in a hard-to-staff subject area or school after graduation. If a student does not fulfill this commitment, the scholarship converts into a loan that must be repaid.
These are two good policies, but there is room for improvement.
A school is classified as “hard-to-staff” if at least 10 percent of its teacher and administrator positions are left vacant or are filled by a teacher who was not fully certified. We need to improve data reporting in order to most accurately evaluate which districts truly are “hard-to-staff.” Without that, this category may become too expansive and not serve its intended purpose.
Crisis Pay for Districts and Schools with Severe Shortages
Targeted incentives could help attract excellent teachers to districts and schools with the most severe staffing challenges, such as Riverview Gardens or Hickman Mills. These incentives could be offered to objectively, highly effective teachers or to top students pursuing education degrees who commit to teaching in high-need districts.
In the healthcare sector, hospitals facing severe staffing shortages sometimes offer a type of premium known as “crisis pay.” Nurses who take these assignments typically earn significantly higher wages than traditionally staffed nurses. Many times these nurses do not buy into the hospital’s retirement plan, health insurance, or paid time off. They also face more constraints in scheduling and many times have harder assignments.27
Education systems could similarly respond when schools face severe staffing challenges. School systems could seek to place their most effective teachers in the schools where students face the greatest challenges. This approach would require careful selection of teachers and would benefit from strong evaluation systems, such as Tennessee’s teacher evaluation model, which helps identify highly effective educators.28
Districts that are facing severe shortages also tend to be among the state’s lowest-performing schools. Table 1 shows selected districts that are both difficult to staff and struggling academically, based on 2024–25 Missouri Assessment Program (MAP) scores and demographic data.
Table 1
Staffing Issues in Low-Performing Schools
| District | % Positions Left Vacant | Location | Enrollment | % Direct Certification | % Proficient or Higher in ELA | % Proficient or Higher in Math |
|---|---|---|---|---|---|---|
| Ridgeway R-V | 37.5% | North MO | 66 | 28% | 21.6% | 17.7% |
| Riverview Gardens | 35.6% | North STL | 5,146 | 62% | 13.6% | 2.5% |
| Normandy Schools Collaborative | 29.5% | North STL | 2,568 | 59% | 13.2% | 7.0% |
| Hickman Mills C-1 | 25.6% | South KC | 4,734 | 41% | 19.4% | 14.4% |
| Clarkton C-4 | 22.7% | Bootheel | 276 | 53% | 13.9% | 16.9% |
| Jennings | 13.7% | North STL | 2,291 | 60% | 20.2% | 15.5% |
Source: moschoolrankings.org, National Center for Educational Statistics
There may be questions on why the lowest-performing schools in the state should receive additional state funding to recruit excellent teachers. Wouldn’t that incentivize bad performance?
In reality, many of these districts have been in a crisis for years—and with it, droves of students have moved through these districts underprepared or unprepared. While it may seem “unfair,” the state should band together to meet this crisis in our most troubled school districts.
Alleviating the true source of shortage pressure could also save the state money compared to issuing broad solutions like an across-the-board teacher pay raise. One partial source of revenue could come from the Teacher Recruitment and Retention State Scholarship Program.
After the passage of Senate Bill 68 in 2025, leftover money from the program can be used to support any student in the final semester of a teacher-preparation program. Instead, that leftover money could instead be redirected towards crisis pay for these districts with the most severe shortages.
If Missouri is going to invest state funds to address the teacher shortage, the money should be directed strategically toward schools and subjects that actually face shortages and challenges.
Local Solutions for School Districts and Schools to Consider
Money may be one way to attract great teachers to troubled schools, but many teachers may be unwilling to teach in a place where they feel unsafe. There are legitimate concerns with violent students or extremely disruptive students.
In 2025, Missouri established a bell-to-bell cell phone ban in public schools. This was a great start and should help improve teaching environments. But the cell phone ban and other disciplinary measures require unity and consistency. If teachers cannot trust administrators to back them in disciplinary decisions, it can make the decision to discipline risky for numerous reasons. At the same time, when teachers openly disregard administrative policies, it undermines administrators’ ability to establish and enforce rules intended to improve classroom behavior.29
While this paper will not delve into disciplinary and cultural policies, they are worth considering as tools to help alleviate shortages in high-need school districts.
Ease Access for Career Switchers
Missouri should make it easier for professionals from other fields to transition into teaching, particularly in high-need subject areas. Career-switchers often bring valuable real-world expertise to the classroom, yet their incentives are limited by the compensation structure of public education. The nearly 500 ABCTE completers in 2023 show that real demand already exists among professionals who want to move into teaching.
Both the traditional step-and-ladder pay system and the defined-benefit pension plan are designed for long-term career teachers—not for professionals entering the field later in life. This structure discourages experienced individuals who may not wish to restart at the lower end of a pay scale or participate in a pension in which they may never be fully vested. Greater flexibility could help attract these candidates. For example, a former physicist entering the classroom late in his career may prefer the option of a 401(k)–style retirement plan instead of a pension.
Acquiring teacher certification also requires time and expense. For career-switchers who already possess deep subject-matter expertise, certification should focus primarily on evaluating whether they have the skills to teach effectively—not whether they have accumulated traditional coursework hours. Reducing unnecessary barriers would allow more qualified professionals to bring their expertise into Missouri’s classrooms, particularly in high-demand subjects such as physics or chemistry.
Data Reporting
Finally, Missouri should have a more uniform method for collecting data and reporting on teacher shortages. Much of the literature on the subject discusses how states need to improve their data on the teacher shortage.30 We see potential areas of real need, but it is difficult to be certain when year-to-year data are inconsistent and districts like the St. Louis City Public Schools are not reporting their FTE vacant positions or how they are being filled. To best target our state’s pressure points, we need to be informed with accurate data.
Conclusion
A review of the literature and of Missouri’s teacher pipeline and statewide hiring data reveals a consistent pattern: Missouri does not face a broad, statewide teacher shortage, but rather a narrow set of challenges concentrated in specific subject areas and high-need school districts.
Avery Frank is a senior policy analyst at the Show-Me Institute. James V. Shuls, Ph.D., is a Senior Fellow at the Show-Me Institute and Head of the Education Liberty Branch of the Institute for Governance and Civics at Florida State University.
Notes
- Fortino, Jodi. Missouri’s Teacher Shortage Isn’t Getting Any Better. Will Lawmakers Act on a Plan to Fix It? KCUR, 10 Apr. 2024, www.kcur.org/education/2024-04-10/missouris-teacher-shortage-isnt-getting-any-better-will-lawmakers-act-on-a-plan-to-fix-it. ↩
- MO SB727 | 2024 | Regular Session, Legiscan, legiscan.com/MO/bill/SB727/2024. ↩
- MO SB68 | 2025 | Regular Session, Legiscan, legiscan.com/MO/bill/SB68/2025. ↩
- Teacher Shortage Report for Missouri. Missouri Department of Elementary and Secondary Education, Dec. 2022, dese.mo.gov/media/pdf/teacher-shortage-report. ↩
- Reference Manual 2025-26: Core Data & Missouri Student Information System, Missouri Department of Elementary and Secondary Education, 15 Sept. 2025, dese.mo.gov/data-system-management/media/pdf/core-data-and-mosis-manual. ↩
- Sutcher, Leib, et al. Understanding Teacher Shortages: An Analysis of Teacher Supply and Demand in the United States. Education Policy Analysis Archives, vol. 27, 2019, p. 35., https://doi.org/10.14507/epaa.27.3696; García, Emma, and Elaine Weiss. The Teacher Shortage Is Real, Large and Growing, and Worse than We Thought. Economic Policy Institute, 26 Mar. 2019, https://doi.org/https://www.epi.org/publication/the-teacher-shortage-is-real-large-and-growing-and-worse-than-we-thought-the-first-report-in-the-perfect-storm-in-the-teacher-labor-market-series. ↩
- Ibid. ↩
- See Figures 3 & 4, Goldhaber, Dan, and Trevor Gratz. School District Staffing Challenges in a Rapidly Recovering Economy. National Center for Analysis of Longitudinal Data in Education Research, 2022. ↩
- García, Emma, and Elaine Weiss. Examining the Factors That Play a Role in the Teacher Shortage Crisis. Economic Policy Institute, 15 Oct. 2020; Other four reports and also; García, Emma, and Elaine Weiss. Low Relative Pay and High Incidence of Moonlighting Play a Role in the Teacher Shortage, Particularly in High-Poverty Schools. Economic Policy Institute, 9 May 2019. ↩
- Missouri Falls to 49th in Teacher Pay. MNEA, 29 Apr. 2025, www.mnea.org/news/missouri-falls-49th-teacher-pay; Walker, Tim. Violence, Threats against Teachers, School Staff Could Hasten Exodus from Profession. NEA, 18 Mar. 2022, www.nea.org/nea-today/all-news-articles/violence-threats-against-teachers-school-staff-could-hasten-exodus-profession; Winters, Ashley. Low Pay, High Burnout Fuels Missouri Teacher Shortage. St. Louis American, 7 Aug. 2025, www.stlamerican.com/education/low-pay-high-burnout-fuels-missouri-teacher-shortage; Riley, Claudette. Springfield Teacher Union: Staff Shortages, “Violent Outbursts” by Students Take Toll. Yahoo!, 5 Nov. 2021, www.yahoo.com/news/springfield-teacher-union-staff-shortages-103002252.html. ↩
- Aldeman, Chad, et al. Examining the Dimensions of Teacher Turnover. National Center for Analysis of Longitudinal Data in Education Research, 2021. ↩
- Shuls, James. The Salary Straitjacket: The Pitfalls of Paying All Teachers the Same. Show-Me Institute, 30 Oct. 2012, showmeinstitute.org/publication/accountability/the-salary-straitjacket-the-pitfalls-of-paying-all-teachers-the-same. ↩
- See page 5, Peyton, David J., et al. Special Education Teacher Shortage: Differences between High and Low Shortage States. Teacher Education and Special Education, 44(1), 2020, pp. 5–23., https://doi.org/10.1177/0888406420906618. ↩
- Goldhaber, Dan, and Trevor Gratz. “School District Staffing Challenges in a Rapidly Recovering Economy.” National Center for Analysis of Longitudinal Data in Education Research, 2022. ↩
- Frank, Avery, and Susan Pendergrass. Our Thoughts on SB 727, Show-Me Institute, 2 Apr. 2024, showmeinstitute.org/blog/education/our-thoughts-on-sb-727. ↩
- Pendergrass, Susan, and Avery Frank. Missouri Condition of Education: 2024, Show-Me Institute, 5 Dec. 2024, showmeinstitute.org/publication/education/missouri-condition-of-education-2024. ↩
- MO SB68 | 2025 | Regular Session, Legiscan, legiscan.com/MO/bill/SB68/2025. Accessed 9 June 2025. ↩
- Facts about the American Board for Certification of Teacher Excellence (ABCTE), Missouri Department of Elementary and Secondary Education, dese.mo.gov/educator-quality/certification/facts-about-american-board-certification-teacher-excellence-abcte. Accessed 14 July 2026; How It Works – Online Teacher Certification | Become a Teacher with American Board, ABCTE, www.americanboard.org/how-it-works/. Accessed 14 July 2026. ↩
- Shuls, James V., and Gary W. Ritter. Teacher Preparation: Not an Either-or (Opinion), Education Week, 13 Feb. 2025, www.edweek.org/education/opinion-teacher-preparation-not-an-either-or/2013/04#:~:text=If%20possible,%20we%E2%80%99d%20do%20a%20rigorous%20study%20of. ↩
- Boyd, D., Lankford, H., Loeb, S., & Wyckoff, J. (2005). The Draw of Home: How teachers’ preferences for proximity disadvantage urban schools. Journal of Policy Analysis and Managemen 24(1), 113–132. ↩
- Rhinesmith, Evan, and Markos Wester-Rivera. Missouri’s Teacher Pipeline: Out-of-State Reciprocity and Alternative Pathways, Prime Center: Saint Louis University, Mar. 2022, drive.google.com/file/d/1CdFZPyU4Xue0O8sNjgAru_WsJs1KLRi8/view. ↩
- Understanding School Lunch Eligibility in the Common Core of Data, IES, 5 Aug. 2020, ies.ed.gov/learn/blog/understanding-school-lunch-eligibility-common-core-data. ↩
- National Center for Education Statistics, ELSi Table Generator, Accessed April 2026. ↩
- Ibid. ↩
- Data was not reported for Alaska, Arkansas, California, Connecticut, Iowa, Louisiana, Massachusetts, New Hampshire, New York, Ohio, Oregon, Vermont, Washington, and Wyoming. (District of Columbia excluded by authors); Nguyen, Tuan D., et al. “What do we know about the extent of teacher shortages nationwide? A systematic examination of reports of U.S. teacher shortages.” AERA Open, vol. 10, Jan. 2024, https://doi.org/10.1177/23328584241276512. ↩
- Frank, Avery. The Silver Lining on the Blue Ribbon Commission Report, Show-Me Institute, 8 Feb. 2023, showmeinstitute.org/blog/education-finance/the-silver-lining-on-the-blue-ribbon-commission-report. ↩
- Why Do Hospitals Pay Travel Nurses So Much? Science Insights, 12 Mar. 2026, scienceinsights.org/why-do-hospitals-pay-travel-nurses-so-much. ↩
- Frank, Avery. Improving Teacher Quality to Improve Reading Quality, Show-Me Institute, 17 Dec. 2025, showmeinstitute.org/article/education/improving-teacher-quality-to-improve-reading-quality. ↩
- Frank, Avery. Senate Bill 68: From Simple Cell Phone Ban to Education Omnibus, Part 1, Show-Me Institute, 13 Jan. 2026, showmeinstitute.org/article/education/senate-bill-68-from-simple-cell-phone-ban-to-education-omnibus-part-1; Frank, Avery. Senate Bill 68: Another Education Omnibus, Part 2, Show-Me Institute, 13 Jan. 2026, showmeinstitute.org/article/education/senate-bill-68-another-education-omnibus-part-2. ↩
- Nguyen, Tuan D., et al. Is There a National Teacher Shortage? A Systematic Examination of Reports of Teacher Shortages in the United States, Annenberg | Brown University, Aug. 2022, files.eric.ed.gov/fulltext/ED629162.pdf. ↩
Appendix
Included Institutions from Title II
The 44 providers listed below have reported data for Missouri’s teacher preparation programs and its teacher pipeline. Providers marked with an asterisk (*) are not institutions of higher education.
American Board for Certification of Teacher Excellence (ABCTE) *
Avila University
Baptist Bible College
Calvary University
Central Methodist University
College of the Ozarks
Columbia College
Cottey College
Culver-Stockton College
DESE Temporary Authorization *
Drury University
Evangel University
Fontbonne University
Hannibal-LaGrange University
Harris Stowe State University
Kansas City Teacher Residency *
Lincoln University
Lindenwood University
Maryville University
Missouri Baptist State University
Missouri Southern State University
Missouri State University
Missouri University of Science & Technology
Missouri Valley College
Missouri Western State University
Northwest Missouri State University
Park University
Rockhurst University
Southeast Missouri State University
Southwest Baptist University
St. Louis Teacher Residency Program *
St. Louis University
Stephens College
Truman State University
University of Central Missouri
University of Missouri-Columbia
University of Missouri-Kansas City
University of Missouri-St. Louis
Washington University
Webster University
Western Governors University – Missouri
Westminster College
William Jewell College
William Woods University
Table A
Missouri Teacher-Preparation Programs by Locale
| Region | Institutions |
|---|---|
| Central Missouri | Central Methodist University, Columbia College, Lincoln University, Missouri University of Science and Technology, Stephens College, University of Central Missouri, University of Missouri – Columbia, Westminster College, William Woods University |
| Kansas City Area (MO Only) | Avila University, Calvary University, Kansas City Teacher Residency, Missouri Valley College, Missouri Western State University, Park University, Rockhurst University, University of Missouri – Kansas City, William Jewell College |
| Northern Missouri | Culver-Stockton College, Hannibal-LaGrange University, Northwest Missouri State University, Truman State University |
| Southeast Missouri | Southeast Missouri State University |
| Southwest Missouri | Baptist Bible College, College of the Ozarks, Cottey College, Drury University, Evangel University, Missouri Southern State University, Missouri State University, Southwest Baptist University |
| St. Louis Area (MO Only) | Fontbonne University, Harris Stowe University, Lindenwood University, Maryville University, Missouri Baptist University, St. Louis Teacher Residency Program, St. Louis University, University of Missouri – St. Louis, Washington University, Webster University, Western Governors University |
Source: Title II, Missouri.
Table B
Number of Teacher Preparation Program Completers by Institution, 2012 to 2023
This table scrolls — drag or swipe within the box below to see all 12 years; the header row and institution names stay in view as you scroll.
| Teacher Preparation Program | 2012 | 2013 | 2014 | 2015 | 2016 | 2017 | 2018 | 2019 | 2020 | 2021 | 2022 | 2023 |
|---|---|---|---|---|---|---|---|---|---|---|---|---|
| American Board for Certification of Teacher Excellence (ABCTE) | 80 | 120 | 165 | 210 | 294 | 375 | 358 | 391 | 219 | 444 | 369 | 496 |
| Avila University | 43 | 44 | 50 | 52 | 20 | 26 | 20 | 20 | 26 | 47 | 33 | 27 |
| Baptist Bible College | 18 | 7 | 10 | 6 | 5 | 4 | 3 | 11 | 10 | 7 | 7 | 7 |
| Calvary University | 3 | 0 | 3 | 2 | 2 | 7 | 3 | 4 | 3 | 4 | 3 | 3 |
| Central Methodist University | 172 | 167 | 163 | 155 | 134 | 131 | 154 | 175 | 195 | 198 | 222 | 209 |
| College of the Ozarks | 57 | 53 | 47 | 40 | 44 | 48 | 26 | 32 | 40 | 36 | 35 | 32 |
| Columbia College | 44 | 51 | 66 | 57 | 48 | 52 | 33 | 39 | 45 | 34 | 26 | 25 |
| Cottey College | 0 | 3 | 5 | 1 | 6 | |||||||
| Culver-Stockton College | 21 | 20 | 22 | 13 | 19 | 23 | 21 | 19 | 25 | 30 | 26 | 23 |
| DESE Temporary Authorization | 148 | 80 | 45 | 66 | 102 | 81 | 39 | 89 | 95 | 92 | 77 | 80 |
| Drury University | 153 | 152 | 127 | 94 | 101 | 98 | 62 | 71 | 81 | 93 | 57 | 60 |
| Evangel University | 58 | 65 | 80 | 42 | 58 | 52 | 43 | 42 | 52 | 62 | 46 | 53 |
| Fontbonne University | 130 | 129 | 128 | 88 | 84 | 62 | 50 | 66 | 43 | 36 | 48 | 38 |
| Hannibal-LaGrange University | 48 | 57 | 49 | 57 | 44 | 33 | 50 | 38 | 43 | 41 | 45 | 32 |
| Harris Stowe State University | 41 | 27 | 17 | 20 | 20 | 17 | 6 | 5 | 5 | 10 | 24 | 21 |
| Kansas City Teacher Residency | 34 | 29 | 48 | 29 | 27 | 39 | 22 | |||||
| Lincoln University | 32 | 47 | 45 | 40 | 30 | 26 | 30 | 30 | 27 | 23 | 18 | 11 |
| Lindenwood University | 282 | 270 | 257 | 243 | 174 | 165 | 142 | 141 | 133 | 119 | 125 | 110 |
| Maryville University | 36 | 48 | 26 | 25 | 32 | 22 | 25 | 21 | 23 | 30 | 22 | 16 |
| Missouri Baptist State University | 185 | 180 | 159 | 98 | 90 | 105 | 65 | 101 | 91 | 88 | 81 | 64 |
| Missouri Southern State University | 116 | 102 | 89 | 108 | 84 | 102 | 91 | 98 | 125 | 108 | 90 | 89 |
| Missouri State University | 523 | 531 | 548 | 591 | 596 | 579 | 433 | 375 | 384 | 418 | 403 | 415 |
| Missouri University of Science and Technology | 11 | 21 | 16 | 14 | 10 | 20 | 9 | 13 | 15 | 26 | 17 | 14 |
| Missouri Valley College | 29 | 33 | 28 | 24 | 17 | 13 | 9 | 9 | 14 | 11 | 10 | 13 |
| Missouri Western State University | 73 | 96 | 138 | 94 | 102 | 68 | 77 | 69 | 91 | 74 | 68 | 70 |
| Northwest Missouri State University | 212 | 219 | 221 | 180 | 172 | 159 | 173 | 218 | 237 | 238 | 230 | 223 |
| Park University | 46 | 38 | 49 | 29 | 32 | 25 | 30 | 15 | 19 | 28 | 21 | 29 |
| Rockhurst University | 95 | 68 | 73 | 54 | 30 | 54 | 41 | 35 | 38 | 19 | 29 | 18 |
| Southeast Missouri State University | 273 | 247 | 252 | 268 | 227 | 170 | 177 | 143 | 207 | 233 | 216 | 208 |
| Southwest Baptist University | 98 | 89 | 95 | 73 | 70 | 77 | 57 | 80 | 54 | 45 | 44 | 50 |
| St. Louis Teacher Residency Program | 8 | 20 | 25 | 19 | 17 | |||||||
| St. Louis University | 41 | 49 | 43 | 41 | 26 | 41 | 37 | 21 | 28 | 32 | 32 | 43 |
| Stephens College | 6 | 7 | 8 | 3 | 6 | 5 | 5 | 4 | 3 | 7 | 6 | 5 |
| Truman State University | 101 | 100 | 84 | 77 | 99 | 104 | 112 | 89 | 80 | 92 | 93 | 73 |
| University of Central Missouri | 398 | 375 | 331 | 295 | 263 | 290 | 269 | 295 | 248 | 238 | 226 | 182 |
| University of Missouri-Columbia | 300 | 318 | 333 | 319 | 302 | 244 | 255 | 267 | 243 | 198 | 219 | 280 |
| University of Missouri-Kansas City | 170 | 166 | 128 | 127 | 89 | 74 | 49 | 51 | 71 | 66 | 73 | 57 |
| University of Missouri-St. Louis | 410 | 437 | 395 | 403 | 301 | 319 | 237 | 245 | 275 | 215 | 208 | 197 |
| Washington University | 23 | 25 | 23 | 27 | 21 | 22 | 14 | 18 | 19 | 22 | 11 | 27 |
| Webster University | 86 | 94 | 97 | 70 | 52 | 40 | 38 | 47 | 40 | 37 | 46 | 36 |
| Western Governors University | 0 | 40 | 50 | 67 | 73 | 89 | 115 | 73 | 78 | |||
| Westminster College | 31 | 32 | 27 | 21 | 24 | 15 | 18 | 9 | 11 | 7 | 9 | 16 |
| William Jewell College | 34 | 18 | 19 | 10 | 13 | 15 | 16 | 10 | 5 | 16 | 12 | 14 |
| William Woods University | 36 | 27 | 33 | 18 | 19 | 23 | 11 | 19 | 16 | 14 | 22 | 13 |
Source: Title II, Missouri. Note: Includes IHEs and non-IHE alternative certification pathways.
Table C
Missouri Teacher Vacancies, Applications, and How They Are Filled by Subject Area, 2018 to 2022
Across the state, hard-to-staff positions typically receive fewer applications per FTE vacancy.
| Subject Area | Average Left-Vacant Rate Ranking | Average FTE Vacancies | Average Applications per Vacancy | Average Certified Applications per Vacancy | Average FTE Left-Vacant Rate | Average FTE Left Vacant + Filled with Inappropriately Certified Teacher Rate |
|---|---|---|---|---|---|---|
| Industrial Technology | 4.0 | 34.8 | 4.7 | 3.0 | 8.4% | 22.0% |
| Technology Education | 5.8 | 26.9 | 9.8 | 8.0 | 7.5% | 16.3% |
| English Language Learners | 6.0 | 101.5 | 7.2 | 5.3 | 6.4% | 11.0% |
| Deaf and Hard of Hearing | 6.2 | 12.2 | 2.8 | 1.9 | 27.3% | 30.8% |
| Early Childhood Special Education | 6.2 | 93.4 | 7.5 | 5.5 | 5.5% | 12.5% |
| Spanish | 7.2 | 76.2 | 6.6 | 5.2 | 4.5% | 9.7% |
| Music-Vocal | 9.8 | 177.4 | 8.4 | 6.7 | 4.0% | 10.5% |
| Physics | 11.6 | 20.2 | 6.9 | 4.3 | 7.2% | 14.7% |
| Biology | 13.6 | 102.3 | 7.6 | 5.7 | 2.3% | 16.3% |
| Mathematics | 13.6 | 496.8 | 8.0 | 6.7 | 2.9% | 9.3% |
| Business | 14.8 | 93.3 | 7.1 | 5.5 | 1.6% | 17.5% |
| Gifted | 15.2 | 55.2 | 7.7 | 5.1 | 3.2% | 8.6% |
| Mild/Moderate Cross Categorical | 15.8 | 1,034.4 | 6.4 | 5.1 | 2.1% | 7.6% |
| Music-Instrumental | 16.2 | 105.9 | 12.7 | 10.8 | 1.6% | 6.2% |
| Blind and Low Vision | 16.4 | 5.6 | 3.4 | 2.5 | 6.5% | 9.0% |
| Science | 16.8 | 204.4 | 8.5 | 6.4 | 2.0% | 11.7% |
| Special Reading | 17.2 | 127.1 | 11.3 | 9.1 | 2.4% | 5.8% |
| Chemistry | 17.4 | 53.3 | 7.4 | 4.9 | 1.8% | 10.7% |
| Family & Consumer Science | 17.8 | 81.6 | 6.2 | 4.9 | 1.7% | 8.6% |
| Health | 18.0 | 47.5 | 13.6 | 10.9 | 2.1% | 6.7% |
| Art | 18.4 | 212.6 | 10.0 | 8.3 | 1.7% | 9.6% |
| Severe Developmental Disability | 18.8 | 22.2 | 14.3 | 13.1 | 1.7% | 6.6% |
| Earth Science | 20.2 | 84.0 | 6.3 | 5.2 | 1.2% | 10.4% |
| English | 20.6 | 235.3 | 12.0 | 10.3 | 1.2% | 6.5% |
| Speech/Theatre | 20.8 | 28.8 | 7.8 | 6.0 | 1.0% | 5.7% |
| Physical Education | 21.4 | 306.9 | 15.2 | 12.9 | 1.1% | 6.4% |
| Language Arts | 21.6 | 307.6 | 10.8 | 8.9 | 1.2% | 6.8% |
| Agriculture Education | 22.0 | 46.3 | 5.8 | 4.5 | 1.0% | 9.4% |
| World Languages | 22.4 | 31.2 | 5.4 | 4.1 | 1.7% | 6.7% |
| Elementary Education | 23.4 | 1,935.5 | 19.4 | 17.4 | 0.8% | 3.6% |
| Early Childhood Education | 23.8 | 315.2 | 12.5 | 10.7 | 0.6% | 4.5% |
| Social Science | 24.4 | 385.7 | 17.5 | 14.3 | 0.5% | 6.8% |
Source: Department of Elementary and Secondary Education.
Selected Vacancy Detail Tables
The tables below break down how St. Louis and Kansas City area local education agencies (LEAs) filled teacher FTE vacancies.
Table D
How St. Louis Area LEAs Filled Teacher FTE Vacancies, 2018 to 2022
Riverview Gardens reported 132 FTE teacher vacancies across different subjects between 2018–2022. Of those 132 reported vacancies, 47 remained vacant (35.6%), 17 were filled with inappropriately certified teachers (12.9%), 0 positions were altered, and 68 were filled with appropriately certified teachers (51.5%).
| Local Education Agency (LEA) Name | Average Enrollment, 2018–22 | Reported FTE Vacancies, 2018–22 | % Left Vacant | % Filled with Inappropriately Certified Teacher | % Positions Altered | % Filled with Appropriately Certified Teacher |
|---|---|---|---|---|---|---|
| Riverview Gardens | 5,243 | 132 | 35.6% | 12.9% | 0.0% | 51.5% |
| Normandy Schools Collaborative | 2,943 | 105 | 29.5% | 1.0% | 0.0% | 69.5% |
| Hawthorn Leadership School for Girls | 146 | 12 | 25.0% | 0.0% | 8.3% | 66.7% |
| Jennings | 2,422 | 51 | 13.7% | 3.9% | 0.0% | 82.4% |
| Kipp St Louis Public Schools | 2,298 | 38 | 13.2% | 21.1% | 0.0% | 65.8% |
| Confluence Academies | 2,580 | 36 | 8.3% | 25.0% | 5.6% | 61.1% |
| Hazelwood | 16,666 | 709 | 5.5% | 0.0% | 0.0% | 94.5% |
| Special School District of St. Louis County | 3,296 | 1,121 | 4.1% | 0.0% | 0.0% | 95.9% |
| Brentwood | 762 | 36 | 2.8% | 0.0% | 0.0% | 97.2% |
| Hillsboro R-III | 3,381 | 77 | 1.3% | 0.6% | 0.6% | 97.4% |
| Fox C-6 | 11,070 | 246 | 1.2% | 0.0% | 0.4% | 98.4% |
| University City | 2,527 | 108 | 0.9% | 0.9% | 0.0% | 98.1% |
| Ferguson-Florissant R-II | 9,575 | 351 | 0.6% | 2.6% | 0.0% | 96.9% |
| Desoto 73 | 2,574 | 123.5 | 0.4% | 0.0% | 1.6% | 98.0% |
| Kairos Academies | 254 | 17 | 0.0% | 52.9% | 0.0% | 47.1% |
| Jefferson Co. R-VII | 1,005 | 12 | 0.0% | 8.3% | 0.0% | 91.7% |
| Grandview R-II | 694 | 45.5 | 0.0% | 4.4% | 4.4% | 91.2% |
| St. Charles R-VI | 4,706 | 61 | 0.0% | 1.7% | 0.0% | 98.3% |
| Mehlville R-IX | 9,958 | 302 | 0.0% | 1.3% | 0.0% | 98.7% |
| Windsor C-1 | 2,876 | 85 | 0.0% | 1.2% | 0.0% | 98.8% |
| Ladue | 4,203 | 114 | 0.0% | 0.9% | 0.0% | 99.1% |
| Clayton | 2,577 | 79 | 0.0% | 0.6% | 0.0% | 99.4% |
| Lindbergh Schools | 7,006 | 272 | 0.0% | 0.4% | 0.0% | 99.6% |
| Parkway C-2 | 17,374 | 580 | 0.0% | 0.2% | 0.2% | 99.7% |
| Dunklin R-V | 1,524 | 32 | 0.0% | 0.0% | 12.5% | 87.5% |
| Rockwood R-VI | 20,676 | 1,224 | 0.0% | 0.0% | 0.1% | 99.9% |
| Affton 101 | 2,529 | 67 | 0.0% | 0.0% | 0.0% | 100.0% |
| Bayless | 1,684 | 42 | 0.0% | 0.0% | 0.0% | 100.0% |
| Francis Howell R-III | 16,679 | 480 | 0.0% | 0.0% | 0.0% | 100.0% |
| Kirkwood R-VII | 5,812 | 174 | 0.0% | 0.0% | 0.0% | 100.0% |
| Maplewood-Richmond Heights | 1,398 | 52.5 | 0.0% | 0.0% | 0.0% | 100.0% |
| Northwest R-I | 6,013 | 121 | 0.0% | 0.0% | 0.0% | 100.0% |
| Orchard Farm R-V | 1,977 | 93 | 0.0% | 0.0% | 0.0% | 100.0% |
| Pattonville R-III | 5,894 | 96 | 0.0% | 0.0% | 0.0% | 100.0% |
| Ritenour | 6,270 | 187 | 0.0% | 0.0% | 0.0% | 100.0% |
| Sunrise R-IX | 295 | 11 | 0.0% | 0.0% | 0.0% | 100.0% |
| Valley Park | 835 | 17 | 0.0% | 0.0% | 0.0% | 100.0% |
| Webster Groves | 4,418 | 108.29 | 0.0% | 0.0% | 0.0% | 100.0% |
| Wentzville R-IV | 16,984 | 687 | 0.0% | 0.0% | 0.0% | 100.0% |
Source: Department of Elementary and Secondary Education (DESE). Note: Blue LEAs are charter schools. Notably, St. Louis City did not report shortage data. Any LEA that is not included did not report more than ten FTE vacancies. This table uses DESE’s regional classification for St. Louis area LEAs. “Positions altered” refers to vacancies that districts modified, reassigned, consolidated, or otherwise restructured in order to maintain operations without filling the original position as posted.
Table E
How Kansas City Area LEAs Filled Teacher FTE Vacancies, 2018 to 2022
Similar trends are seen in Kansas City, but at a much lower magnitude than St. Louis. The high-poverty Hickman Mills C-1 had far more difficulty in staffing than every other traditional school district.
| Local Education Agency (LEA) Name | Average Enrollment, 2018–22 | Reported FTE Vacancies, 2018–22 | % Left Vacant | % Filled with Inappropriately Certified Teacher | % Positions Altered | % Filled with Appropriately Certified Teacher |
|---|---|---|---|---|---|---|
| Frontier Schools | 1,579 | 43 | 27.9% | 16.3% | 0.0% | 55.8% |
| Hickman Mills C-1 | 5,122 | 394 | 25.6% | 1.0% | 0.0% | 73.4% |
| Hope Leadership Academy | 113 | 11 | 18.2% | 27.3% | 0.0% | 54.5% |
| Lee A. Tolbert Community Academy | 464 | 27 | 14.8% | 37.0% | 0.0% | 48.1% |
| Allen Village | 536 | 25 | 6.0% | 26.6% | 0.0% | 67.3% |
| Kansas City 33 | 13,830 | 869 | 5.4% | 4.0% | 0.1% | 90.5% |
| Academy For Integrated Arts | 229 | 19 | 5.3% | 10.5% | 0.0% | 84.2% |
| Oak Grove R-VI | 1,933 | 21 | 4.8% | 0.0% | 0.0% | 95.2% |
| University Academy | 1,108 | 54 | 3.7% | 16.7% | 3.7% | 75.9% |
| North Platte County R-I | 590 | 28 | 3.6% | 0.0% | 0.0% | 96.4% |
| West Platte County R-II | 640 | 30 | 3.3% | 3.3% | 3.3% | 90.0% |
| Grandview C-4 | 3,934 | 169 | 3.0% | 0.6% | 1.2% | 95.3% |
| Center 58 | 2,469 | 185 | 2.2% | 17.0% | 0.0% | 80.8% |
| Smithville R-II | 2,601 | 95 | 2.1% | 5.3% | 0.0% | 92.6% |
| Lee’s Summit R-VII | 17,793 | 526 | 1.4% | 0.0% | 0.0% | 98.6% |
| Guadalupe Centers Schools | 1,257 | 72 | 1.4% | 0.0% | 0.0% | 98.6% |
| Excelsior Springs 40 | 2,558 | 99 | 1.0% | 2.0% | 0.0% | 97.0% |
| Belton 124 | 4,385 | 219 | 0.9% | 0.0% | 0.0% | 99.1% |
| Crossroads Charter Schools | 888 | 111 | 0.9% | 14.9% | 0.0% | 84.2% |
| Harrisonville R-IX | 2,292 | 122 | 0.8% | 0.8% | 8.2% | 90.2% |
| Raytown C-2 | 8,187 | 309 | 0.6% | 2.9% | 1.6% | 94.8% |
| Independence 30 | 14,039 | 398 | 0.5% | 1.8% | 0.0% | 97.7% |
| Raymore-Peculiar R-II | 6,211 | 234 | 0.4% | 4.3% | 0.0% | 95.3% |
| Liberty 53 | 12,486 | 298 | 0.3% | 7.4% | 0.0% | 92.3% |
| Park Hill | 11,633 | 422 | 0.2% | 1.4% | 0.0% | 98.3% |
| North Kansas City 74 | 20,183 | 649 | 0.2% | 0.0% | 0.0% | 99.8% |
| Academie Lafayette | 1,112 | 31 | 0.0% | 47.5% | 0.0% | 52.5% |
| Genesis School Inc. | 243 | 11 | 0.0% | 45.5% | 0.0% | 54.5% |
| Hogan Preparatory Academy | 1,012 | 162 | 0.0% | 34.6% | 6.8% | 58.6% |
| Brookside Charter School | 679 | 48 | 0.0% | 27.1% | 0.0% | 72.9% |
| Kipp: Endeavor Academy | 623 | 26 | 0.0% | 23.1% | 0.0% | 76.9% |
| Citizens of the World Charter | 394 | 21 | 0.0% | 19.0% | 0.0% | 81.0% |
| Drexel R-IV | 291 | 11 | 0.0% | 18.2% | 0.0% | 81.8% |
| Lone Jack C-6 | 665 | 19 | 0.0% | 13.5% | 0.0% | 86.5% |
| Sherwood Cass R-VIII | 772 | 18 | 0.0% | 11.1% | 0.0% | 88.9% |
| Midway R-I | 436 | 24 | 0.0% | 8.3% | 8.3% | 83.3% |
| Gordon Parks Elementary | 156 | 30 | 0.0% | 6.7% | 0.0% | 93.3% |
| Archie R-V | 505 | 21 | 0.0% | 4.8% | 0.0% | 95.2% |
| Jackson R-II | 5,184 | 167 | 0.0% | 1.8% | 0.0% | 98.2% |
| Pleasant Hill R-III | 2,165 | 116 | 0.0% | 0.9% | 0.0% | 99.1% |
| Grain Valley R-V | 4,392 | 158 | 0.0% | 0.6% | 0.0% | 99.4% |
| Strasburg C-3 | 122 | 10 | 0.0% | 0.0% | 15.0% | 85.0% |
| Blue Springs R-IV | 14,482 | 341 | 0.0% | 0.0% | 0.0% | 100.0% |
| Fort Osage R-I | 4,836 | 146 | 0.0% | 0.0% | 0.0% | 100.0% |
| KC International Academy | 640 | 64 | 0.0% | 0.0% | 0.0% | 100.0% |
| Kearney R-I | 3,499 | 109 | 0.0% | 0.0% | 0.0% | 100.0% |
| Platte County R-III | 4,187 | 94 | 0.0% | 0.0% | 0.0% | 100.0% |
| Scuola Vita Nuova | 313 | 22 | 0.0% | 0.0% | 0.0% | 100.0% |
Source: Department of Elementary and Secondary Education (DESE). Note: Light-blue LEAs are charter schools. Notably, St. Louis City did not report shortage data. Any LEA that is not included did not report more than ten FTE vacancies. This table uses DESE’s regional classification for St. Louis area LEAs. “Positions altered” refers to vacancies that districts modified, reassigned, consolidated, or otherwise restructured in order to maintain operations without filling the original position as posted.
Figure A
Selected St. Louis Area School Districts and the Percent of FTE Positions Left Vacant by Subject Area, 2018 to 2022
These districts see difficulties in hard-to-staff subject areas (see Figure 11 in the main text). However, the high vacancy rates in elementary education (one of the easiest subjects to staff in Missouri) for Normandy and Riverview Gardens signify strong and unique shortage pressure for these hard-to-staff districts.
| Hazelwood | Normandy Schools Collaborative | Riverview Gardens |
|---|---|---|
| Industrial Technology (44%) | Art (100%) | Biology (100%) |
| Early Childhood Special Education (30%) | Business (100%) | English Language Learners (100%) |
| Special Reading (24%) | English Language Learners (100%) | Physics (100%) |
| Spanish (20%) | Health (100%) | Science (75%) |
| Music – Instrumental (17%) | Technology Education (100%) | Mathematics (63%) |
| Mathematics (9%) | Music – Vocal (67%) | Art (50%) |
| Social Science (8%) | Biology (50%) | Music – Vocal (50%) |
| Science (7%) | Mathematics (33%) | Social Science (50%) |
| Gifted (6%) | Music – Instrumental (33%) | Physical Education (33%) |
| Art (4%) | Science (25%) | Language Arts (31%) |
| English Language Learners (4%) | Elementary Education (24%) | Elementary Education (24%) |
| Language Arts (4%) | Early Childhood Education (20%) | Business (0%) |
| Physical Education (4%) | Physical Education (20%) | Early Childhood Education (0%) |
| Biology (0%) | Language Arts (10%) | English (0%) |
| Business (0%) | Chemistry (0%) | Family & Consumer Science (0%) |
| Chemistry (0%) | Family & Consumer Science (0%) | Music – Instrumental (0%) |
| Early Childhood Education (0%) | Social Science (0%) | Chemistry (NR) |
| Earth Science (0%) | World Languages (0%) | Deaf and Hard of Hearing (NR) |
| Elementary Education (0%) | Deaf and Hard of Hearing (NR) | Early Childhood Special Education (NR) |
| English (0%) | Early Childhood Special Education (NR) | Earth Science (NR) |
| Family & Consumer Science (0%) | Earth Science (NR) | Gifted (NR) |
| Health (0%) | English (NR) | Health (NR) |
| Music – Vocal (0%) | Gifted (NR) | Industrial Technology (NR) |
| Physics (0%) | Industrial Technology (NR) | Mild/Moderate Cross Categorical (NR) |
| Speech/Theatre (0%) | Mild/Moderate Cross Categorical (NR) | Severe Developmental Disability (NR) |
| Technology Education (0%) | Physics (NR) | Spanish (NR) |
| World Languages (0%) | Severe Developmental Disability (NR) | Special Reading (NR) |
| Deaf and Hard of Hearing (NR) | Spanish (NR) | Speech/Theatre (NR) |
| Mild/Moderate Cross Categorical (NR) | Special Reading (NR) | Technology Education (NR) |
| Severe Developmental Disability (NR) | Speech/Theatre (NR) | World Languages (NR) |
Source: Missouri Department of Elementary and Secondary Education (DESE). Note: Subjects shown in gray had fewer than 5 vacant positions that needed to be filled; NR indicates no vacancies were reported for that subject.
Figure B
Selected Kansas City Area School Districts’ Five-Year Vacancy Rates by Subject Area, 2018 to 2022
Hard-to-staff districts in Kansas City were more consistent in data reporting than those in St. Louis. Kansas City 33, with less-severe staffing shortages than Hickman Mills, felt pressure in hard-to-staff subject areas, while Hickman Mills faced difficulties in most subject areas.
| Hickman Mills | Kansas City 33 |
|---|---|
| Technology Education (100%) | Early Childhood Special Education (36%) |
| Biology (75%) | Physics (33%) |
| Early Childhood Special Education (60%) | Music – Vocal (22%) |
| Family & Consumer Science (50%) | English Language Learners (17%) |
| English Language Learners (44%) | Art (14%) |
| Mild/Moderate Cross Categorical (41%) | Physical Education (12%) |
| Chemistry (40%) | Business (10%) |
| Mathematics (40%) | Language Arts (10%) |
| Gifted (33%) | Biology (7%) |
| Physics (33%) | Social Science (6%) |
| Speech/Theatre (33%) | Science (5%) |
| Music – Vocal (31%) | Mathematics (4%) |
| English (27%) | English (3%) |
| Science (25%) | Mild/Moderate Cross Categorical (3%) |
| Earth Science (20%) | Special Reading (3%) |
| Language Arts (17%) | Elementary Education (2%) |
| Elementary Education (12%) | Chemistry (0%) |
| Social Science (11%) | Deaf and Hard of Hearing (0%) |
| Physical Education (7%) | Early Childhood Education (0%) |
| Early Childhood Education (4%) | Family & Consumer Science (0%) |
| Art (0%) | Music – Instrumental (0%) |
| Business (0%) | Severe Developmental Disability (0%) |
| Music – Instrumental (0%) | Spanish (0%) |
| Spanish (0%) | Speech/Theatre (0%) |
| Special Reading (0%) | Technology Education (0%) |
| Deaf and Hard of Hearing (NR) | World Languages (0%) |
| Health (NR) | Earth Science (NR) |
| Industrial Technology (NR) | Gifted (NR) |
| Severe Developmental Disability (NR) | Health (NR) |
| World Languages (NR) | Industrial Technology (NR) |
Source: Missouri Department of Elementary and Secondary Education (DESE). Note: Subjects with no vacancies reported are marked NR.