Key Takeaways
- Critics of interdistrict open enrollment (IOE) argue that allowing students to cross district boundaries will disrupt district enrollments and, in turn, disrupt district finances.
- However, we find no evidence that IOE increases enrollment volatility, and if there are no major enrollment disruptions, there can be no funding disruptions, because funding changes due to IOE follow from enrollment changes. Thus, our findings give no evidence to suggest IOE will disrupt district budgets.
- We further find no evidence that the introduction of IOE leads to mass migrations of students into popular districts, or out of unpopular This is partly explained by the fact that even in states with strong IOE policies, the overwhelming majority of families continue to enroll their children in their resident districts. Commonsense features of IOE policies also help—for instance, one reason that popular districts are not overrun is that they are not required to admit students beyond their capacity.
- Alternatively, proponents of IOE argue it can transform public education by sparking meaningful interdistrict competition for students. Our findings do not entirely rule this out, though they suggest it is unlikely, at least in the first five years.
- Holistically, our results suggest that IOE is not a systemic disruptor of the residentially based school assignment system. Instead, it appears to provide increased mobility for a relatively small but meaningful share of families for whom the local district is not a good fit. While IOE is unlikely to produce the sweeping changes anticipated by its strongest advocates—or feared by its strongest critics—it can still help many families have better educational experiences.
Introduction
Interdistrict open enrollment (IOE) allows public K–12 students to enroll in schools outside of their residentially zoned districts. Many states have IOE policies; Missouri does not. Policies in some states allow students to move between districts with few restrictions, while in others they are quite restrictive.
Proponents of IOE point to several benefits of the policy. First, it expands families’ options to find schools that meet their children’s needs. IOE advocates claim it can help students zoned to persistently low-performing schools to access better educational opportunities. It can also help with other challenges, such as families attempting to distance themselves from bullies, or families of students with Individualized Education Plans (IEPs) that the local district is ill-suited to implement. Regardless of why a family wants to move, IOE provides new options.
A related concern is school safety. Recent guidance from the federal Department of Education signals a renewed commitment to the Unsafe School Choice Option (USCO) in federal law. USCO dates back to the 1965 Elementary and Secondary Education Act and requires states to ensure that students in persistently dangerous schools are provided the opportunity to attend a safe public elementary or secondary school. IOE is one channel through which the requirements of the law can be satisfied.
Zooming out, proponents also argue that IOE could produce systemic effects by encouraging competition between districts. The logic is that with sufficiently expansive open enrollment, local school districts can no longer count on geographically “trapped” families to enroll. Competition brings out the best in service providers in other sectors of the economy. Why should education be different?
Opponents generally do not dispute that individual families should have choices. Rather, they focus on concerns about equitable access, the erosion of local governance, and the potential for IOE to disrupt school district enrollments. The latter concern is arguably the most prominent in policy debates about IOE in Missouri. The worry is that with IOE in place, student mobility could cause large enrollment fluctuations across districts. These fluctuations would make district management more difficult, causing some districts to be overwhelmed with students while leaving others underenrolled. Some struggling schools, or even districts, could close. Schwalbach (2023) provides a recent overview of these concerns.11. Schwalbach, J. (2023). School Districts Often Oppose Open Enrollment. Why That’s a Mistake. The74 (05.23.2023). Retrieved August 16, 2025, from https://www.the74million.org/article/school-districts-often-oppose-open-enrollment-why-thats-a-mistake.
Lurking beneath the surface is the issue of school funding. Large enrollment fluctuations can change enrollment-based funding from the state. Districts that lose too many students could face financial pressure. A related concern is that districts with substantial local funding—presumably net importers of students in a well-functioning IOE environment—would be obligated to spend their local resources on students from outside the district, whose families are not contributing local taxes.
However, these potential effects depend fundamentally on how IOE influences student enrollment patterns. Despite heated rhetoric, there is little empirical evidence on IOE’s effect on district enrollments. We fill this gap in research by conducting an empirical evaluation of how statewide IOE policies influence district enrollment patterns across five states: Colorado, Kentucky, Oklahoma, Tennessee, and Wisconsin. These states reflect the full spectrum of IOE policy strength across the United States, from restrictive to expansive. In each state, we construct a data panel tracking school and district enrollments for five years before and (when possible) five years after IOE implementation.
At the outset, there is good reason to expect that the disruptive effect of IOE will be limited because even in states with strong and mature policies, most students continue to enroll in their residentially assigned districts. For instance, IOE participation rates in states with long-standing, highly rated IOE policies such as Arizona, Colorado, and Wisconsin range from 8 to 12 percent of K–12 students, while in other states—even some with strong policies—rates often fall between 1 and 5 percent (e.g., Arkansas, Oklahoma, and West Virginia).22. Schwalbach, J. (2025). K–12 Open Enrollment by the Numbers 2025. Reason Foundation, May 2025; https://reason.org/wp-content/uploads/k-12-open-enrollment-numbers-2025.pdf. We include Colorado and Wisconsin in our analysis, but due to data issues we were unable to include Arizona.
Given these participation rates, the argument that IOE is a system disruptor seems limited. This is especially true if districts are commonly both senders and receivers of students. However, the potential for IOE to disrupt enrollments could be larger if the enrollment shifts it facilitates are sufficiently concentrated. For instance, if students disproportionately use IOE to move into or out of particular districts, these districts could see large changes even if most districts are unaffected. This ambiguity underscores the need for our empirical analysis.
Our findings give no indication that IOE policies lead to meaningful changes in district enrollment stability within the first five years. We generally cannot distinguish district enrollment fluctuations after the introduction of IOE from business-as-usual enrollment fluctuations that occurred prior to its implementation. This finding is robust to several different measures of enrollment fluctuations, including measures meant to isolate acute enrollment increases in high-demand districts and enrollment decreases in low-demand districts. In addition, there is no evidence that IOE leads to school or district closures.
These findings suggest that many of the points raised on both sides of the IOE debate are largely moot. For instance, opponents imagine extreme inequity emerging from IOE whereby some districts are left with populations of acutely needy students because all others have left (National Education Policy Center, 2022). Ignoring the obvious moral issue of the implied alternative—that is, is it desirable to trap some students in areas of concentrated need to support their highest-need peers?—there is no evidence of such mass migrations occurring via IOE. Similarly, opponents’ concerns about the erosion of local school governance (and local funding support) do not hold up, because districts do not experience substantial influxes of out-of-district students due to IOE.
On the proponents’ side, our analysis provides no support for the claim that strong IOE policies will transform public education by sparking meaningful interdistrict competition for students. We cannot rule out systemic competitive effects conclusively because the limited enrollment response to IOE could be inclusive of such effects. For instance, enrollment shifts in response to IOE may fail to materialize if weaker districts quickly improve in response to the competitive environment. Still, although we cannot rule out this explanation entirely, we view it as less likely than simpler alternatives. Our preferred explanation is that even when IOE policies are strong, most families choose not to participate. The fact that most students choose to attend a local district school, even with IOE in place, is consistent with a 2024 survey from EdChoice showing that the top reason families give for choosing a public school is proximity.33. Ritter, Colyn, et al. (2024). Schooling in America. EdChoice, August 2024, https://www.edchoice.org/ wp-content/uploads/2024/08/2024-Schooling-in-America.pdf. There are many explanations for this—for example, most families are happy with their local school, transportation is convenient, and they prefer to send their children to the same school as their neighborhood friends—but the bottom line is that relatively few families cross district boundaries, limiting the potential for IOE to generate systemic change.
Where does this leave us? Our findings are consistent with IOE facilitating district mobility for a meaningful number of families, but not enough to disrupt the larger school system. This takes the wind out of the sails on both sides of the debate to some extent, but it is important to acknowledge that the opportunities afforded to these families via IOE can be quite valuable to them. IOE is unlikely to have the transformative effect on public education that the strongest proponents of the policy might hope for, or that the strongest opponents might fear, but it can still help many families have better educational experiences.
Background and Popular Sentiment
The Open Enrollment National Policy Landscape
Minnesota was the first state to enact a statewide open-enrollment law in 1988, followed by Utah in 1990.44. Poiner, J. (2023). The Policies, Perceptions, and Implications of Open Enrollment. Fordham Institute, June 13, 2023; fordhaminstitute.org/ohio/ commentary/policies-perceptions-and-implications-open-enrollment. Since then a variety of open-enrollment programs have emerged across the country. As of 2024, 43 states have some form of open enrollment, though in many states the policies are restrictive and only a fraction have strong IOE policies.55. 50-State Comparison: Open Enrollment Policies. Education Commission of the States (ECS), https:// www.ecs.org/50-state-comparison-open-enrollment-policies.
A strong IOE policy is one with few restrictions. Common restrictions allow either the sending or receiving district to deny a transfer request without cause, or require families to pay tuition to transfer. By contrast, a strong policy is statewide, universal, tuition-free, and transparent, and it permits students to enroll in a school in a new district as long as seats are available.
The Reason Foundation’s 2025 report “Public School Without Borders” identifies 16 states that have strong statewide IOE policies.66. Schwalbach, J. (2025). Public Schools Without Boundaries 2025. Reason Foundation, October 2, 2025; https://reason.org/open-enrollment/public-schools-without-boundaries-2025. Missouri technically has an open-enrollment policy on the books, but it scored very poorly in the report—tied for second to last among all states—because the Missouri policy is severely restrictive and is for all practical purposes currently defunct. The one exception in Missouri is that during the 2025 legislative session, a law was passed allowing school employees, along with contractors who work for a school, to send their children to that school even if they are not district residents. This is the extent of IOE in Missouri today.
Popular Sentiment
EdChoice conducts national opinion polls on education issues, including IOE. Figure 1 summarizes its findings with respect to open enrollment in 2025:77. The Public, Parents, and K–12 Education. National Polling Report #2, EdChoice, Aug. 2025, edchoice. mcdatahub.com/edchoice.
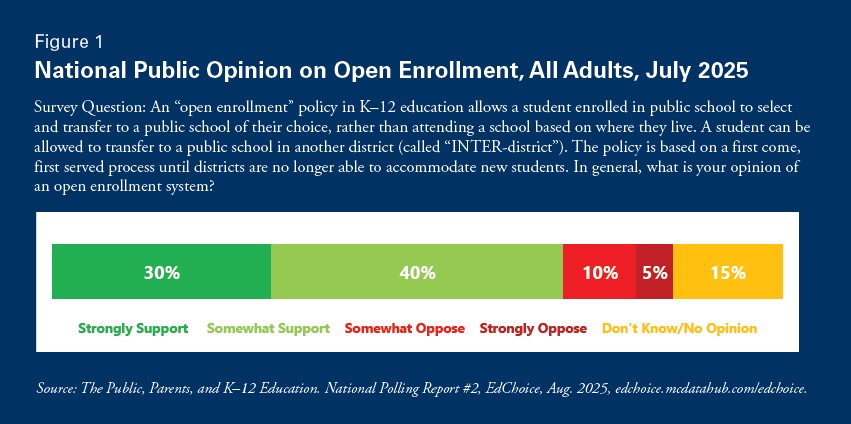
Figure 1 shows widespread support for open enrollment, with 70 percent of survey respondents indicating they strongly or somewhat support open enrollment. Only 15 percent oppose or strongly oppose open enrollment. In additional subgroup analyses, the EdChoice survey shows that support for open enrollment is similar on both sides of the political aisle. It is strongly or somewhat strongly supported by 72 percent of both self-identified conservatives and self-identified liberals and progressives. Individuals living in urban areas—where the use of open-enrollment policies is most feasible due to population density—are among the strongest supporters of open enrollment (75 percent).
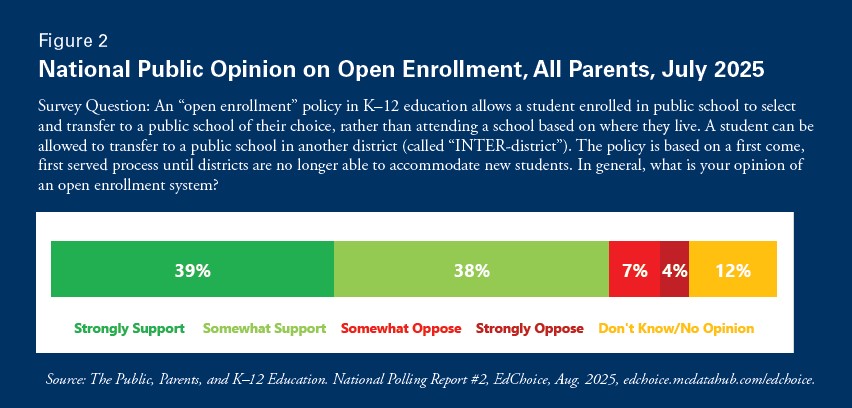
Figure 2 shows data from the same survey indicating support for open enrollment is even stronger among parents than among the larger adult population.
Opinion in Missouri largely aligns with the national sentiment. Figure 3 shows similar results from a 2024 survey of likely Missouri voters conducted by St. Louis University (SLU). The question on the SLU survey is not exactly the same—it focuses specifically on interdistrict open enrollment, not intradistrict policies—and the level of support for open enrollment is lower overall. However, it is still a clearly positive issue across party lines88. SLU/YouGov Poll, 2025: https://slu.edu/research/ research-institute/big-ideas/slupoll-spring2025-education-legislation-memo.pdf.
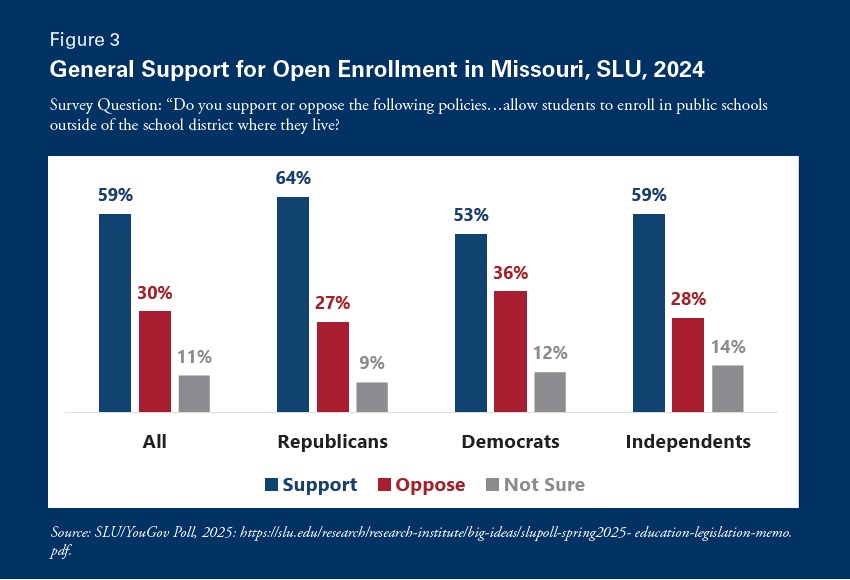
Diving deeper into the SLU survey, only a minority of survey respondents indicated that they would support restrictive IOE policy features if IOE were passed. Specifically, only 30 percent of respondents supported letting districts block transfers out of their own districts, and only 39 percent supported letting districts opt out of receiving students who wanted to transfer in. That 39 percent number is all the more surprising because the survey question asked by SLU is unconditional—that is, it simply asked if each respondent is in favor of a policy in which “school districts may opt out of having students transfer into their districts.” In any feasible IOE policy, opting out would be conditional on district capacity constraints. Or, stated differently, no district would be required to take students if all of its seats are full. If the question were properly conditioned, the percentage of respondents supporting the restriction would likely be even lower.
In sum, open enrollment is widely supported by the public, parents, and likely voters in Missouri. Further, likely voters in Missouri support a strong policy with minimal restrictions on student mobility.
What Would a Strong Open Enrollment Policy Look Like in Missouri?
Missouri has repeatedly come close to passing IOE legislation. A version of IOE has passed out of the House five years in a row, only to stall each time in the Senate. Unlike in the House, IOE can be filibustered in the Senate, and multiple senators have blocked it from reaching the floor for a vote.99. Frank, A., and Pendergrass, S. Open Enrollment: Erasing Seven Myths in Missouri. Show-Me Institute, March 2025; showmeinstitute.org/wp-content/ uploads/2025/03/20250224-Open-Enrollment-Frank_Pendergrass.pdf.
The most recent version to make it through the House, House Bill 711 in 2025, was quite restrictive. It allowed districts to opt out of receiving transfer students regardless of capacity and imposed a three-percent-of-enrollment cap on the number of students who could transfer out of a district annually in order to protect undesirable districts from losing too many students. Despite these restrictions, which made the version of IOE in HB 711 far more restrictive than what voters say they want, it couldn’t get across the finish line in Jefferson City.
A strong IOE policy aligned with the preferences of Missouri voters would mandate district participation while allowing districts to set capacity limits. That is, districts would need to make open seats available, but would not be forced to become overcrowded, and resident students would have unambiguous enrollment priority. A strong policy would also lift the cap on the number of students who could transfer out of a district. Our empirical analysis below suggests this would likely be a symbolic move, because IOE is not being used by families in other states to flee districts en masse. Still, it sends a clear signal that it is the well-being of children rather than of adults or institutions that drives the policy. A strong policy would also prohibit districts from charging tuition or discriminating against transfer applicants. If a district is oversubscribed, meaning more students apply than there are seats available, a lottery would determine which students got to enroll.
In terms of financing, the effects of IOE on district budgets would occur through its effects on enrollment. The primary channel is through the state’s student-based funding formula. Enrollment-based funding would increase for a receiving district that gains a student via IOE, and similarly, the sending district would no longer count that student as part of its own enrollment. The funding implications could be asymmetric across the sending and receiving districts due to complexities in the state funding formula (which is currently under consideration for reform).
A concern is that transfer students would be likely to use IOE to move from poorer districts with less local funding to wealthier districts with more local funding, and that this would be unfair to taxpayers in wealthier districts. To some extent this concern is justified, but with an important caveat: Under any reasonable IOE policy—including those already in place in other states—districts would not be required to accept more students than they have capacity to serve. This means IOE students would only fill open seats in receiving districts, and thus the marginal cost of educating them will be lower than the average cost in the district. Stated differently, the extra cost of educating an IOE student who is filling an open seat in a classroom that is already functioning—with the physical space, curriculum, and teacher in place—is lower than the cost of educating the average student in the district. In many cases, the state funding that follows the student would be sufficient to cover the marginal cost, and might even exceed it, without requiring additional local resources.
It also bears mentioning that the use of IOE by aspiring students looking for a better educational experience—whom one would expect to transfer mostly from lower-income, less-resourced districts to higher-income, more-resourced districts—represents a form of social redistribution that many find desirable.1010. Fehr, E., and Schmidt, K.M. (2006). The Economics of Fairness, Reciprocity and Altruism—Experimental Evidence and New Theories. In Handbook of the Economics of Giving, Altruism and Reciprocity (Serge-Christophe Kolm and Jean Mercier Ythier, eds.). Elsevier; Fong, C. (2001). Social Preferences, Self-Interest, and the Demand for Redistribution. Journal of Public Economics 82, 225–246; Wilhelm, M.O., and Bekkers, R. (2010). Helping Behavior, Dispositional Empathic Concern, and the Principle of Care. Social Psychology Quarterly 73(1), 11–32. Though many redistributive policies are complex and difficult to implement without perverse incentives and government inefficiency, IOE is a relatively clean policy. It gives students and families willing to help themselves the opportunity to do so, and at low cost if the policy is well-designed. It is also an example of a redistributive policy that improves efficiency, under the modest assumption that transferring students are better matches for their new districts than their original districts, in which case overall student-to-school match quality in the system improves with IOE.
State Policies
We analyze existing IOE policies in five states: Colorado, Kentucky, Oklahoma, Tennessee, and Wisconsin. We selected these states to reflect the spectrum of different types of IOE policies used in practice. The policies in Kentucky and Tennessee are restrictive and allow for limited transfers, the policy in Oklahoma is very strong and permit transfers broadly, and the policies in Colorado and Wisconsin are mostly strong but have some restrictive features or lack full transparency. In all states, as is typical of IOE policies nationally, parents are the default providers of transportation for transferring students. Our goal in analyzing the policies in these five states is to give a sense of how IOE might affect Missouri school districts if implemented in different ways.
Following are brief descriptions of each state’s IOE policy.1111. These descriptions draw on Jude Schwalbach’s Public Schools Without Boundaries 2025, published by the Reason Foundation (https://reason.org/open-enrollment/public-schools-without-boundaries-2025).
Colorado
Policy Strength: Mostly Strong Year Implemented: 1994–95
Colorado has a longstanding (1994) statute requiring that all districts participate in IOE and offer within-district open enrollment without charging tuition. Colorado’s policy is generally strong, and today about eight percent of its K–12 students are enrolled in a nonresident district through IOE.1212. Schwalbach, J. (2025). K–12 Open Enrollment by the Numbers 2025. Policy Report. Reason Foundation. However, the policy has some limitations. Most notably, districts can deny applications for reasons outside of capacity, such as for lack of prerequisites, age requirements, and academic performance. Colorado’s policy is also weak in terms of data transparency. Districts are not required to report their available capacity, nor are they required to give a reason to applicants who are denied enrollment.
Kentucky
Policy Strength: Weak
Year Implemented: 2022–23
Kentucky’s IOE policy is relatively new; it was adopted in the summer of 2022. It is a weak policy, requiring only that school districts establish a policy governing how they will participate. This effectively makes it voluntary, as one way districts can satisfy the requirement is by creating a policy according to which they will not participate in IOE.
If districts choose to participate, they can deny applicants for a variety of reasons, including GPA, and transferring students cannot participate in school sports for a calendar year. The receiving district can also charge a “reasonable tuition fee” to be paid by the sending district upon mutual approval of the transfer. Lastly, Kentucky districts are not required to report their available capacity or why applicants are denied enrollment.
Oklahoma
Policy Strength: Strong
Year Implemented: 2022–23 (partial year); 2023–24 (first full year)
Oklahoma’s IOE policy was first put into effect on January 1, 2022. All districts are required to participate in IOE without charging tuition. School districts are required
to report their available seats by grade level and school site to the state. If applicants exceed seats, a randomized lottery determines who is awarded a spot. School districts are required to report transfer data, including rejected applications and the rationale. School districts must also
report the number of approved and rejected students with disabilities. The state also performs a quarterly randomized audit of 10 percent of Oklahoma’s school districts’ approval and denials. (In 2024, the law was amended to require districts to offer within-district open enrollment in addition to participating in IOE.)
Tennessee
Policy Strength: Weak
Year Implemented: 2014–15
Tennessee passed voluntary IOE in 2013–14 and implemented it in 2014–15. The Tennessee policy is another example of a weak policy. Cross-district transfers are at the discretion of the receiving district’s school board and districts are permitted to charge tuition to nonresident students. Further, districts can deny applicants for reasons unrelated to capacity and are not required to inform an applicant why he or she was denied.1313. Tennessee revised its policy in 2021–22 and improved some of its processes but did not alter its fundamental features.
Wisconsin
Policy Strength: Strong
Year Implemented: 1998–99
IOE began in Wisconsin in 1998–99 and has been updated periodically. Today, over 70,000 students, or about eight percent of K–12 enrollment, participate in IOE. Rural districts are net importers of transfer students.1414. Frank, A. and Pendergrass, S. Open Enrollment: Erasing Seven Myths in Missouri. Show-Me Institute, Mar. 2025, showmeinstitute.org/wp-content/ uploads/2025/03/20250224-Open-Enrollment-Frank_Pendergrass.pdf.
All districts must participate in statewide IOE for both sending and receiving transfers. Furthermore, schools must accept students as long as they have available seats, and they must use a randomized lottery to determine who is admitted when applications exceed capacity (with limited exceptions, such as when a student has been expelled previously). No tuition is required for participating families. Students can also attend individual courses in a nonresident district in its part-time open enrollment.1515. Kava, R. Open Enrollment Program. Legislative Fiscal Bureau of the State of Wisconsin. Jan. 2025; docs. legis.wisconsin.gov/misc/lfb/informational_papers/ january_2025/0032_open_enrollment_program_ informational_paper_32.pdf. (Wisconsin also has within-district open enrollment, but participation is voluntary.)
Data and Methodology
Data
Our analysis draws on publicly available school enrollment data from the National Center of Education Statistics’ (NCES) Common Core of Data (CCD). For each state in our sample, we collected enrollment data for five years before and (when possible) five years after IOE was implemented. Exceptions are Kentucky and Oklahoma, where the policies are too new to have five years of post-implementation data (for these states, we examine post-policy trends using all available data).
We focus on a window of 5 years before and after the introduction of IOE in order to plausibly isolate the policy’s impact. It would also be of interest to study changes in enrollment fluctuations over a longer time horizon in each state, but extending the time horizon comes with the concern that other confounding factors will increasingly influence enrollment dynamics. Thus, our findings are not directly informative about the long-run impacts of IOE.
We collect enrollment data at the school level and aggregate up to the district level for portions of our analysis. The CCD is widely regarded as a high-quality dataset and the primary variable we use in our analysis—school enrollment—is a simple measure. That said, there are some data anomalies. We describe how we clean the data to address the anomalies in Appendix A. A replication package with data and code is also available upon request.
As noted previously, the sample states were chosen to reflect a range of IOE policy strength across U.S. states and are not meant to be representative of the nation. Still, they vary along many dimensions including demographics, rurality, and poverty levels. In addition, three of the states border Missouri: Kentucky, Oklahoma, and Tennessee. The general consistency of our findings across this diverse set of states underscores the robustness of our findings.
Measures and Methods
From the enrollment data we construct several different measures that capture the potential for IOE to disrupt school districts. Our first measure is based on year-to-year
district enrollment fluctuations. For each district j in year t, we calculate the enrollment fluctuation as the absolute value of the difference between enrollment in year t and year t–1. That is, we calculate the change in enrollment between years, regardless of whether enrollment increases or decreases. We then average the absolute values across all districts in a state for a given year, producing a statewide summary measure of district enrollment instability. It is important that we calculate enrollment changes in absolute values; otherwise, positive and negative fluctuations would cancel each other out in the average, which could mask substantial enrollment fluctuations across school districts overall. We use versions of this measure based on raw enrollment counts and using enrollment percentages, with year-t enrollment serving as the base for the latter.
It is important to recognize that even in the absence of IOE, districts regularly experience enrollment fluctuations. To assess the effect of IOE, we look for evidence that these fluctuations become more severe when IOE is implemented. More severe fluctuations would be expected if large numbers of students are using IOE to systematically leave or enroll in particular districts (e.g., from district A to B and C, but not B to A or C to A).
Our analysis based on absolute annual enrollment fluctuations is appealing because it is a comprehensive measure of enrollment stability, inclusive of all districts in a state. However, it may miss some extreme effects of IOE. For instance, it could be that enrollment fluctuations do not change much on average, but a small number of districts experience substantial disruptions.
To assess this possibility, we construct additional indicators. First, we examine the tails of the enrollment-fluctuation distribution by assessing the 5th and 95th percentiles. The 5th percentile typically captures negative enrollment changes, while the 95th percentile typically captures large positive changes. These metrics allow us to detect whether extreme enrollment fluctuations—whether declines or increases—become more common after IOE implementation.1616. In results suppressed for brevity we also conduct this analysis even deeper in the tails of the distribution of enrollment fluctuations, at the 3rd and 97th percentiles. As we move further into the tails of the distribution, the trends become more volatile, but our substantive conclusions are unchanged.
To illustrate how our percentile metrics work, consider a state with 100 school districts. The 95th percentile enrollment fluctuation in a given year is the fifth largest increase among the 100 districts.1717. To be more precise, by common convention it is the value between the 5th- and 6th-largest increases. If the 95th percentile value increases after IOE implementation, it would suggest that at least some districts are experiencing substantial enrollment increases due to IOE. Note that IOE can increase the 95th percentile value even if it causes enrollment surges at fewer than five percent of districts. This is because as IOE pushes some new districts into the top five percent, the enrollment changes in other high-growth districts get pushed down in the distribution.1818. For example, consider a hypothetical district with high enrollment growth that was at the 97th percentile before IOE, but was not affected by IOE directly. This district might get pushed down from the 97th to 95th percentile when IOE is implemented because other districts that are affected could experience new, larger enrollment growth. The shift from the 97th to 95th percentile for this unaffected district—caused by larger enrollment fluctuations at other districts—would increase the 95th percentile value.
A similar logic applies to our analysis at the 5th percentile, where we’re looking for evidence of large out-migrations from a small number of districts.
An advantage of our percentile-based approach is that we can test for localized impacts of IOE on a small subset of districts without the need as researchers to prespecify the characteristics of districts that are likely to gain or lose students. This makes our tests stronger. To illustrate with an example, it is intuitive that wealthier districts will be more likely to gain students than less-wealthy districts under IOE. However, it may not be the wealthiest districts that gain the most students because other factors are in play. For instance, it could be that districts with medium wealth, but in close proximity to especially poor performing districts, gain the most students when IOE is implemented. Our percentile-based approach is agnostic about which aspects of districts drive enrollment fluctuations under IOE—regardless of the cause, they will pick up the change.
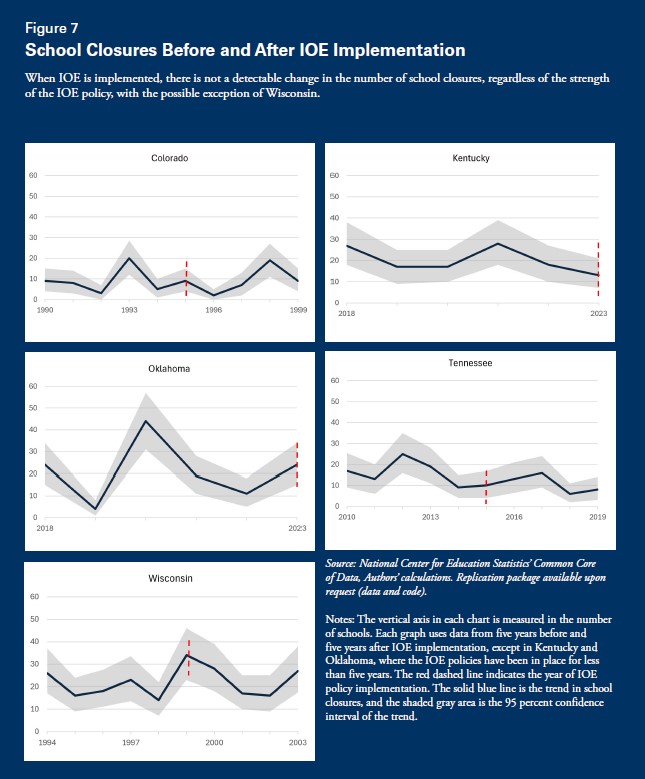
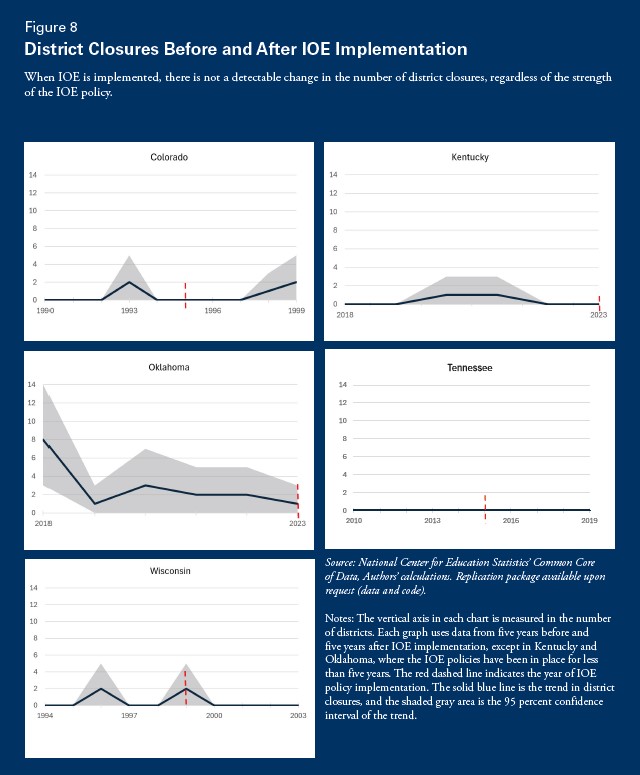
Beyond our percentile-based analysis, we also explore the potential for IOE effects on school and district closures. Even more so than our analysis at the 5th percentile of the distribution of enrollment fluctuations, our analysis of closures looks for evidence that IOE is putting extreme pressure on some districts by facilitating student departures. We identify a school or district closure as occurring when an institution with positive enrollment in year t ceases to have enrollment for two consecutive years.1919. Note that our measures of enrollment fluctuations, along with school and district closings, sometimes require that we use data from outside of the regular data window to construct them—e.g., in the last year of each data panel we need to look forward one additional year to confirm school and district closures using our two-year definition. See Appendix A for more information.
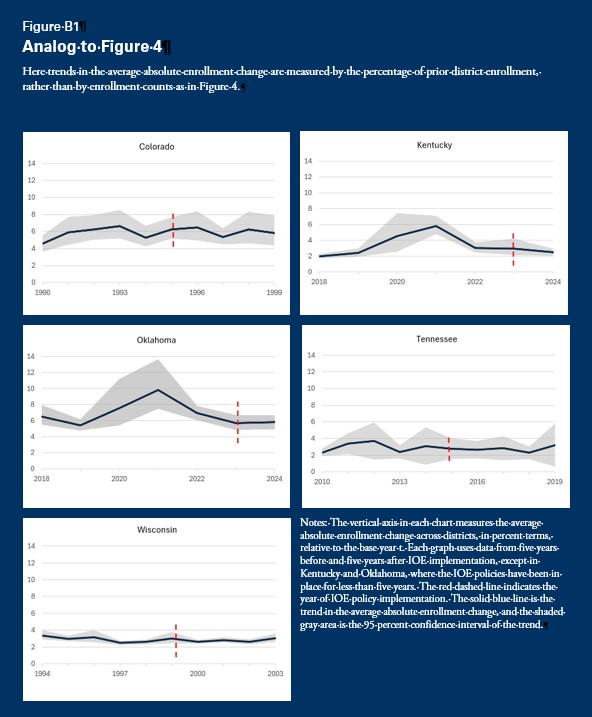
We plot trends in the five metrics—the average absolute value, the 5th and 95th percentile values of enrollment fluctuations, and school and district closures—over the five years before and after IOE is implemented in each state. Each plot includes a 95-percent confidence interval, constructed using a district-clustered bootstrap, to quantify uncertainty arising from sampling variance. These intervals provide a benchmark for evaluating the magnitudes of observed changes coinciding with IOE. Intuitively, the confidence intervals represent the range of enrollment trend pathways one might reasonably expect in each state. When observed changes are small relative to these intervals, they are unlikely to be meaningful. We provide more information about the construction and interpretation of the confidence intervals in Appendix A.
Results
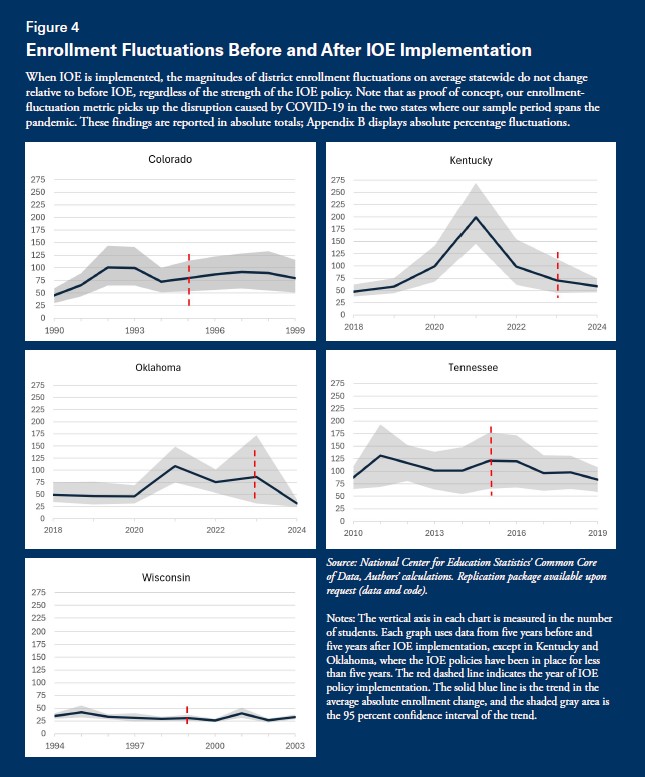
We begin with our primary measure of enrollment disruption: the average absolute enrollment change. Figure 4 shows the trend in each sample state for the five years before and after IOE was introduced, again with the caveat that we cannot look forward the full five years in Kentucky and Oklahoma, where the policies are too recent. The years denoted on the horizontal axis represent the spring semester of the school year (e.g., 2010 for the 2009–10 school year, etc.). The red vertical line in each figure indicates when the IOE policy took effect.2020. Note that per above, 2022 was a partial implementation year in Oklahoma, where IOE took effect in January of 2022. However, our enrollment data from the CCD are based on the fall, so the effect of IOE wouldn’t show up in the data until 2023 (i.e., the 2022–23 school year). Thus, for our analysis of Oklahoma we mark the first policy year as 2023.
There is little suggestion in the data from any state that IOE affects the average absolute enrollment change across districts. Moreover, there are several up-and-down spikes that happen during pre-policy years. The most notable spikes are in 2021 in Kentucky and Oklahoma, which reflect enrollment fluctuations caused by the COVID pandemic. These spikes indirectly validate our measurement approach: our enrollment-fluctuation measure captures a major, known shock to enrollment patterns, demonstrating that it is sensitive to true disruptions.
Overall, Figure 4 offers no support for the claim that IOE changes district enrollment fluctuations on average. Appendix B presents similar results when absolute enrollment fluctuations are expressed as percentages relative to each district’s baseline enrollment (Figure B1 in Appendix B).
Next, in Figure 5 we examine enrollment fluctuations at the 95th percentile—i.e., in districts that experience large year-over-year positive enrollment changes. This is to explore the possibility that the trends in Figure 4 mask larger enrollment fluctuations in highly sought-after districts, which could be bombarded with new enrollees when IOE is implemented. Such an effect—if highly concentrated—could be hidden in our sample-average analysis in Figure 4 but would show up in Figure 5. However, there is no evidence in Figure 5 to suggest that IOE increases extreme positive enrollment fluctuations in any state.
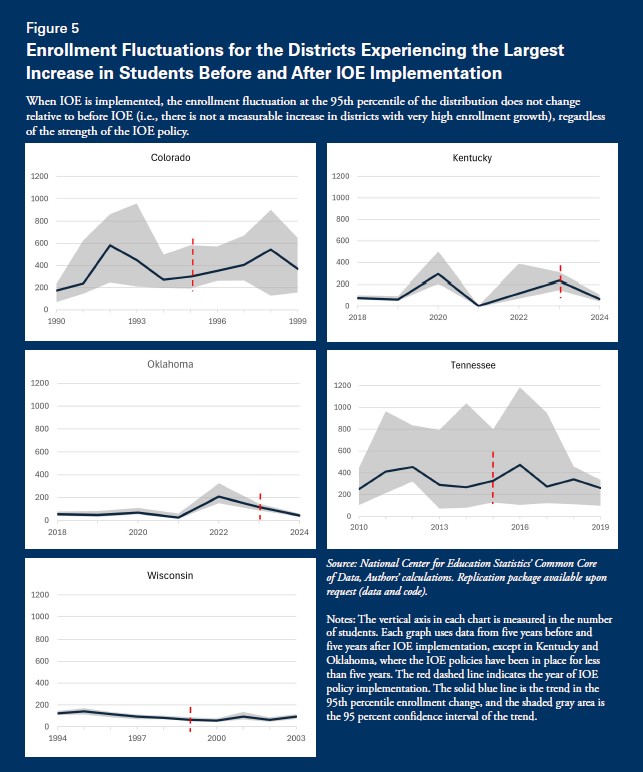
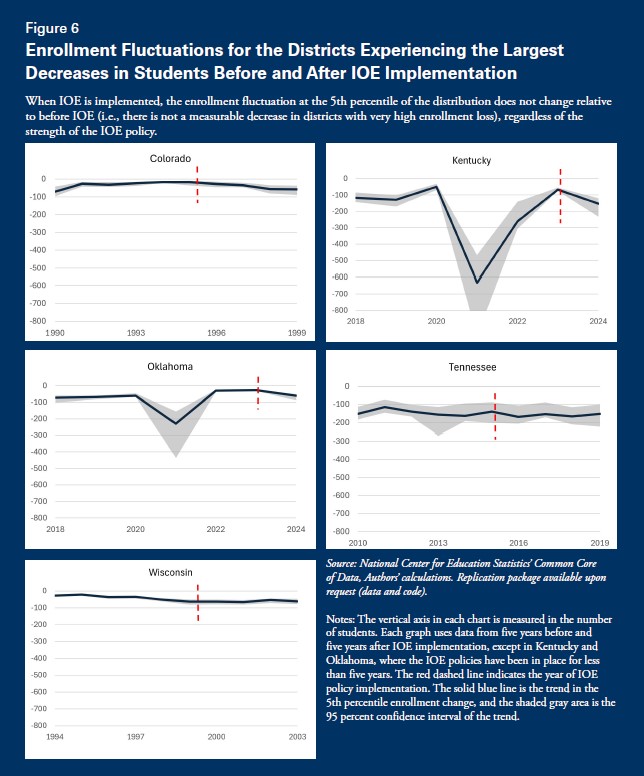
Figure 6 shows analogous results at the 5th percentile, where district enrollment is declining. Here we are looking for evidence that students are using IOE to flee some districts en masse. But again, there is no such evidence. Notably, the data from Kentucky and Oklahoma again show the effect of students fleeing districts during the COVID pandemic. The pandemic changes dwarf anything that came after, including the introduction of IOE.
Finally, in Figures 7 and 8 we examine school and district closures. School closures, and especially district closures, are rare events, but if IOE’s impact is sufficiently concentrated they could be affected. However, we find no consistent evidence that IOE increases school or district closures. Wisconsin shows a brief spike in school closures during the year IOE was implemented, but the effect dissipates quickly and is not replicated in other states.
Conclusion
Taken holistically, our findings provide little support for the hypothesis that IOE impacts district enrollment stability. The implementation of IOE is not consistently associated with disruptions to district enrollment, on average or in the tails of the distribution, nor is it consistently related to district and school closures, within the first five years of implementation. This is true in states with weak policies, such as Kentucky and Tennessee, and states with strong policies, such as Colorado, Wisconsin, and Oklahoma. Our findings suggest that a strong IOE policy in Missouri, which would provide more families with the opportunity to find a school that best fits their needs, can be implemented without destabilizing school districts or otherwise meaningfully impacting district enrollments.
These findings have implications for the likely effects of IOE on district budgets because the financial impacts of IOE follow directly from its effects on enrollment. Our null results give no reason to expect that IOE would cause meaningful changes in district finances, at least through the first five years.
A point of context borne out by our analysis is that even in the absence of IOE, districts experience substantial enrollment fluctuations. These fluctuations likely reflect a variety of factors, including shifting local demographics, families moving into or out of an area, changes in competition from private schools, and more recently, the pandemic-related shift to homeschooling. Our finding that IOE does not meaningfully affect enrollment fluctuations is in the context of this pre-existing churn. Said differently, we find that when IOE is implemented, whatever effect it has on district enrollment patterns is dominated by the business-as-usual enrollment fluctuations districts already experience.
Our results may be surprising—and sobering—to both strong advocates and opponents of IOE. On the opponents’ side, our analysis gives little cause for concern about individual districts being overwhelmed or abandoned. For proponents, while our results do not rule out competitive effects of IOE conclusively, they suggest such effects, to the extent they exist, are likely small. (Recall we cannot rule out competitive effects conclusively because the lack of post-IOE enrollment fluctuations could reflect immediate competitive responses from districts fighting to keep their students.)
Several factors help explain why rhetoric and reality diverge when it comes to IOE. One is that some of the biggest concerns raised by opponents of IOE are common-sense issues easily addressed with basic policy design. For instance, the concern that high-demand districts will be overrun with students is addressed by rules that allow districts to prioritize resident enrollment and deny transfers once they reach capacity. Even in states with strong policies that mandate district participation, districts are not required to take more students than they have space for.
More fundamentally, we believe our null findings primarily reflect the fact that education is a locally provided service and most families prefer the local option. They might prefer it because it is a high-quality option, but even if not, there are other reasons they may
still choose to stay local—these include commuting convenience (again noting that parents are the default providers of transportation for transfer students) and the social benefits that come with their children attending the same schools as their neighborhood friends. Regardless, the bottom line is that IOE does not appear to be a system disruptor, but rather a system accessory.
Given these findings, would it make sense for Missouri to pass a strong IOE policy? We believe the answer to this question is unequivocally yes. Not because it will change the system—our results suggest this is unlikely—but rather because buried in our data, there are real families that benefit from IOE participation. These families do not constitute a large enough fraction of the population to disrupt the system, but they are using IOE to find better educational options for their children. Given that we do not find systemwide costs to providing these options, denying these families access would serve no purpose.
Appendix A: Data and Methodology Details
In this appendix we elaborate on our data construction and cleaning processes, and the estimation procedure for our bootstrapped error bands.
Data
Our foundational data are school-by-year enrollment records in the sample states from the Common Core of Data. All district-level enrollment metrics are aggregations of the school enrollment data. Appendix Table A1 indicates the timespan of our data panel in each state, which is built to cover plus or minus five years around the implementation of IOE, when possible.
Charter schools are coded differently across the states in our sample. In Colorado charter schools are coded as part of their local public school districts, and in Tennessee and Wisconsin, the vast majority (over 90 percent) are coded this way. In contrast, in Oklahoma, charter schools are coded as separate entities outside of local districts and therefore appear in the data as stand-alone districts. Kentucky is the only sample state without any active charter schools during our study period.
We note these cross-state differences for completeness, but they are unlikely to affect our results (substantively) for two reasons. First, our analysis relies on within-state comparisons of enrollment before and after IOE implementation. As long as charter schools are coded consistently within a state over time, cross-state differences in coding conventions should not influence our estimates. Second, charter school enrollment represents a small share of total K–12 public enrollment in all sample states. This is particularly true in Colorado, Tennessee, and Wisconsin, where charter enrollment never exceeds three percent of students in our panels.21In Colorado, charter schools are not separately identified in the data during our sample period. We gain inference about their representation by examin-ing data in 2000, which is the first year charters are separately identified and the year after our Colorado data panel closes. Charter enrollment in Colorado in the year 2000 was 2.5 percent of total K–12 public enrollment, which we assume is at or above the high value in the 1990s. We also note that in Tennessee, and as described below, we exclude schools involved with the Memphis and Shelby County school district merger; the numbers reported here reflect the charter enrollment share in our sample excluding these districts and schools. Although the charter share is higher in Oklahoma—largely because the Oklahoma data panel covers more recent years—it is still modest, ranging from 4 to 12 percent across years.
There is no indication of widespread errors in the CCD enrollment data; nonetheless, there are some anomalous entries. To minimize the potential for data errors to influence our results, we cleaned the data using the following process. We began by flagging anomalous school-by-year enrollment observations that met any of the following conditions:
- Inconsistent enrollment: The current year has positive, non-missing enrollment while both the prior and following years have enrollment that is either zero or missing.
- Anomalous enrollment fluctuations when the current and previous year’s enrollment values are non-zero (the following conditions are designed to capture quick up-and-down enrollment spikes that are unlikely to be real): Both the forward and backward absolute percentage changes in enrollment exceed 40 percent, AND both the forward and backward absolute enrollment changes exceed 100 (to avoid flagging small schools where larger fluctuations in percentage terms may be real), AND the year is not the final year in the dataset, AND a sign change in enrollment growth occurs, AND the school does not meet the criteria for a long-term shutdown.
- Anomalous enrollment fluctuations when current enrollment is greater than zero but previous enrollment is missing or unavailable: The forward-looking absolute percentage change in enrollment exceeds 200 percent.
For school-year observations in the first group, we set the enrollment value to missing, which effectively drops them from our sample. For school-year observations in the other two groups, we overwrite the anomalous enrollment value by linearly interpolating between the nearest two years of enrollment data for the school. That is, we smooth the data through the anomaly.
With the cleaned enrollment data, we construct the enrollment and closure variables. Constructing these variables requires that we collect some data from outside of the plus or minus five-year window in each state. For instance, the enrollment-fluctuation variables in the first year of each state data panel require data from the preceding year. For closures, we identify a closure as occurring whenever a school or district with non-zero enrollment has at least two consecutive years of zero enrollment. Therefore, our definition of closures similarly requires that we use preceding data to identify schools and districts that could have closed in the first year of each data panel. In addition, the closure variables also require us to look forward in the data to identify closures in the last year. For our analyses in Colorado, Tennessee, and Wisconsin it is straightforward to collect these data outside the panel window; in Kentucky and Oklahoma, where the IOE policies are new and the five-year post-policy period is already truncated, we assess closure outcomes for one fewer year because we use the last year of data to identify closures from the prior year.
Finally, we briefly note a data issue in Tennessee. In 2013, there was a substantial merger between the Memphis and Shelby County School Districts. The merger involved over 200 schools. Tracking district and school enrollment fluctuations through the merger proved difficult, and ultimately we dropped the merger districts and all schools involved in the merger from the data panel entirely.
The Construction of Our Cluster Bootstrapped Confidence Intervals
The trend in each enrollment stability metric is accompanied by a 95 percent confidence interval of possible values. We construct the confidence intervals using a district-clustered bootstrap. For the bootstrapping procedure, we resample districts from the full distribution of districts in each state, with replacement, 2,000 times. At each iteration, we calculate each enrollment fluctuation and closure metric over the sample period. We construct the 95-percent confidence interval for each observed trend as the range of estimates obtained between the 2.5th and 97.5th percentiles of the empirical distribution of bootstrapped values.
Bootstrapping is a common tool used in applied economic research to quantify sampling variance.22Horowitz, J.L. (2019). Bootstrap methods in econometrics. Annual Review of Economics 11, 193–224. In our application, we’re treating each observed value in a state-year as the realization of a random process, acknowledging that if the same process that generated district enrollments in a given year was replayed again and again in a state, the outcome would be a little different each time. The confidence intervals give a range of estimates that could reasonably arise from the same fundamental process, played out repeatedly in our states.
Appendix B: Supplementary Results