• Publications
    • Essay
    • Case Study
    • Policy Study
    • Report
    • Testimony
    • Other
    • Newsletter
  • Blog
    • Daily Blog
    • Podcasts and Radio
    • Video
    • Infographics
    • Commentary / Op-Eds
    • Events
  • Events
  • Donate
  • About
    • Our Team
    • Show-Me Institute Board of Directors
    • Fellows and Scholars
    • Our Authors
    • Jobs
  • Contact
  • Explore Topics
    • Education
      • Accountability
      • Education Finance
      • Performance
      • School Choice
    • Health Care
      • Free-Market Reform
      • Medicaid
    • Corporate Welfare
      • Special Taxing Districts
      • Subsidies
      • Tax Credits
    • Labor
      • Government Unions
      • Public Pensions
    • State and Local Government
      • Budget and Spending
      • Courts
      • Criminal Justice
      • Municipal Policy
      • Property Rights
      • Transparency
      • Transportation
    • Economy
      • Business Climate
      • Energy
      • Minimum Wage
      • Privatization
      • Regulation
      • Taxes
      • Welfare
      • Workforce
Show Me InstituteShow Me Institute
Support the Show-Me Institute
  • Publications
    • Essay
    • Case Study
    • Policy Study
    • Report
    • Testimony
    • Other
    • Newsletter
  • Blog
    • Daily Blog
    • Podcasts and Radio
    • Video
    • Infographics
    • Commentary / Op-Eds
    • Events
  • Events
  • Donate
  • About
    • Our Team
    • Show-Me Institute Board of Directors
    • Fellows and Scholars
    • Our Authors
    • Jobs
  • Contact
  • Explore Topics
    • Education
      • Accountability
      • Education Finance
      • Performance
      • School Choice
    • Health Care
      • Free-Market Reform
      • Medicaid
    • Corporate Welfare
      • Special Taxing Districts
      • Subsidies
      • Tax Credits
    • Labor
      • Government Unions
      • Public Pensions
    • State and Local Government
      • Budget and Spending
      • Courts
      • Criminal Justice
      • Municipal Policy
      • Property Rights
      • Transparency
      • Transportation
    • Economy
      • Business Climate
      • Energy
      • Minimum Wage
      • Privatization
      • Regulation
      • Taxes
      • Welfare
      • Workforce
Education / Accountability

DESE’s APR Summary Reports Hide Achievement Gaps
By Abigail Burrola on Dec 4, 2019
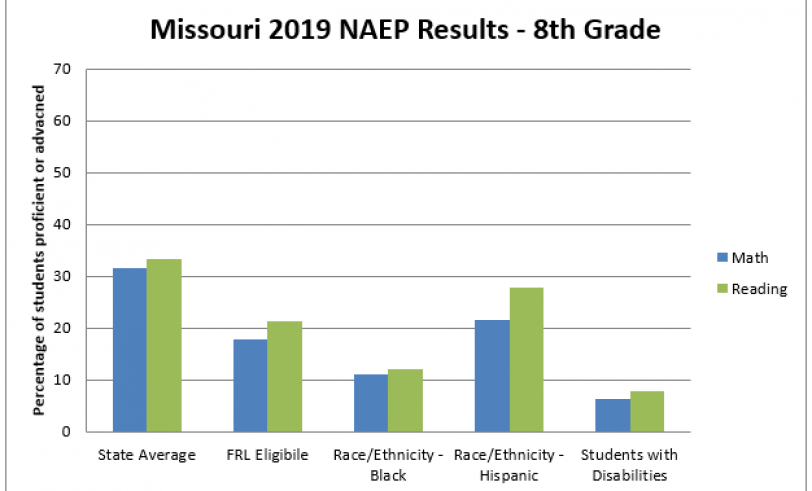
Proficiency graph

If you want to find out how Missouri students are performing, you might think you could go to the Department of Elementary and Secondary Education’s (DESE) website to find out. After all, it’s DESE’s job to house the state’s education data. But you’d be wrong, because DESE isn’t nearly as helpful or transparent as it should be.

The Annual Performance Report (APR) on the DESE website does contain some information. However, as Show-Me Institute writers have pointed out, this report doesn’t show how many students are performing at grade level. It lacks clear labels, leaving the reader confused about what the terms mean. It also doesn’t present the raw data, it only gives results, on an undefined 100–500 color-coded scale, after DESE has gone through the APR calculations. Those calculations are not explained.

Within the APR summary report is the subgroup achievement section. That’s a likely place to look for achievement gaps, but this section isn’t helpful either. It is hard to tell how students in different subgroups are doing because DESE uses a “super subgroup.” The super subgroup is a combination of scores from Black students, Hispanic students, students who quality for free and reduced-price lunch (indicating a low family income), students with disabilities, and English Language Learners. There is no information about performance from each group separately.  

In contrast, resources like the National Assessment of Educational Progress (NAEP), also known as the “Nation’s Report Card,” show student’s academic achievement and disparities between different groups of students.

Missouri’s NAEP result data can easily be broken out to provide a clear picture of achievement gaps. The starkest gaps are for students with disabilities. Only 6 percent of Missouri’s 8th grade students with disabilities were proficient in math, and only 8 percent were proficient in reading. That’s 26 and 25 percent lower than the state average, respectively. Other subgroups, including students who qualify for free and reduced price lunch programs and Black and Hispanic students, also have lower rates of proficiency than the state average, as shown in the graph at the top of this post.

The NAEP results provide valuable information for parents about how Missouri students are performing. DESE’s APR Report, with its “super subgroup” that hides more than it reveals, leaves parents in the dark.

Why should Missouri parents have to go searching beyond DESE’s website for information they need? They shouldn’t. DESE should be helping, not hindering parents (and taxpayers) who want to know how their schools are performing.


  • Share
  • Tweet
  • Share
  • Email
  • Print
About the author

Abigail Burrola

More about this author >
    Footer Logo
    Support the Show-Me-Institute
    Showmeinstitute.org is brought to you by Show-Me Institute and Show-Me Opportunity.
    • Publications
    • Blog
    • Events
    • Donate
    • About
    • Contact

    Reprint permission for Show-Me Institute publications and commentaries is hereby granted, provided that proper credit is given to the author. We request, but do not require, that those who reprint our material notify us of publication for our records: [email protected]

    Mission Statement
    Advancing liberty with responsibility by promoting market solutions for Missouri public policy.

    © Copyright 2023 All Rights Reserved